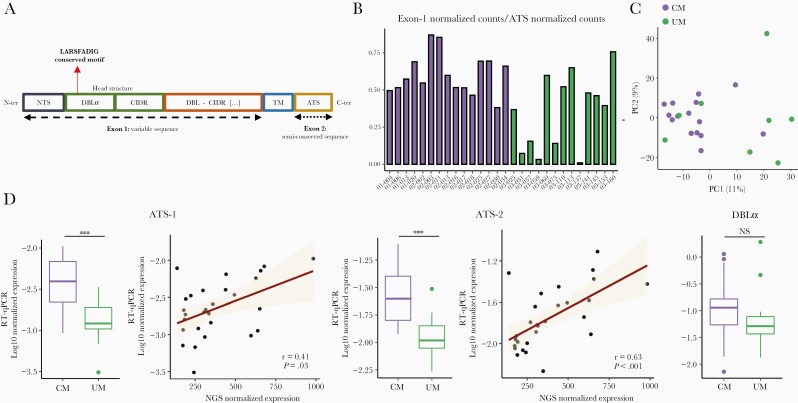
Figure 3.
var genes expression. (A) Plasmodium falciparum Erythrocyte Membrane Protein 1 (PfEMP1) schematic organization. (B) Proportion of assembled var genes in each sample. We compared the number of reads mapped to exon 1 and ATS to assess the quality of reconstructions. (C) Principal component analysis (PCA) based on var genes domains expression. (D) Var genes expression based on DBLα and ATS domains. Distribution of normalized expression values measured by RT-qPCR in cerebral malaria (CM) and uncomplicated malaria (UM) is represented (boxplot). The P values were calculated with the Mann-Whitney U test and are represented as follows: *** <.001, ** <.01, and * <.05. The correlation between the normalized expression values measured by RT-qPCR and RNA-seq was represented through the regression line and tested by the Spearman rank test (Spearman rank correlation coefficient ρ and P values are shown).

