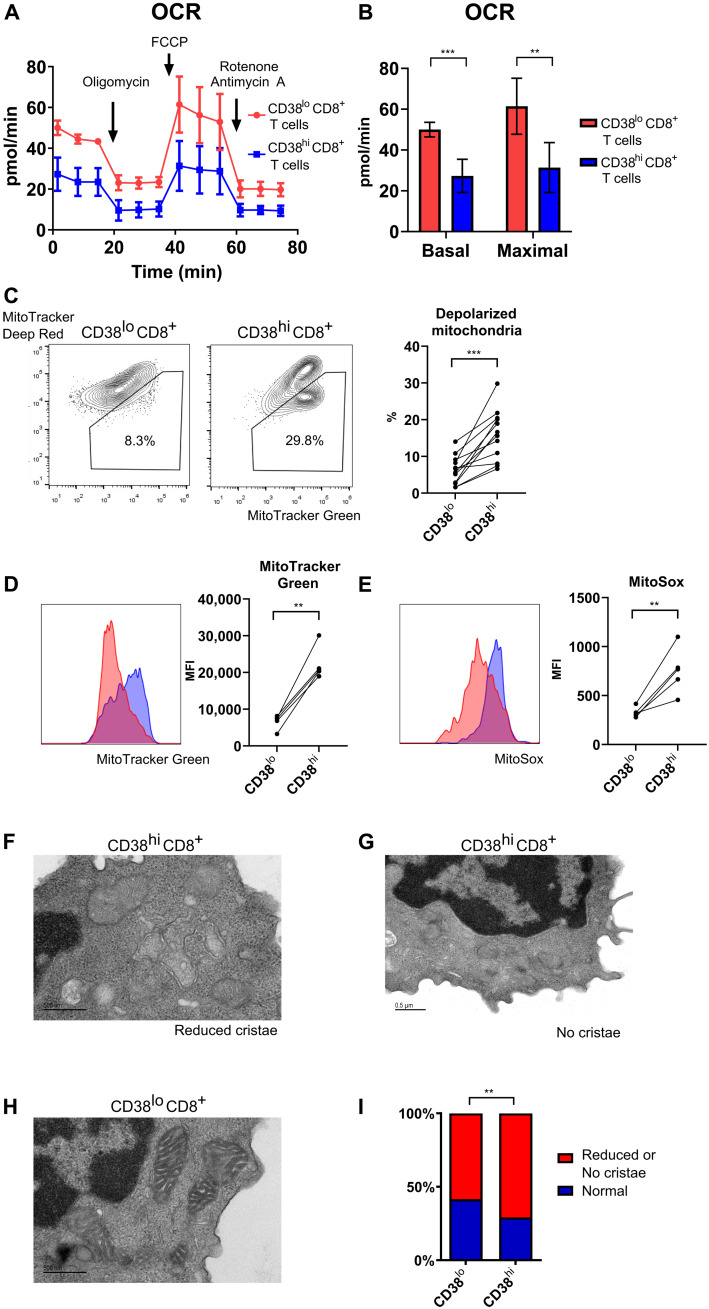
Fig. 1. CD38hiCD8+ T cells present with numerous mitochondrial defects.
(A) Oxygen consumption rate (OCR) of CD38hiCD8+ and CD38loCD8+ T cells sorted from healthy donor at baseline and after addition of oligomycin, carbonyl cyanide p-trifluoromethoxyphenylhydrazone, and rotenone/antimycin A. (B) Basal and maximal OCR of CD38hiCD8+ and CD38loCD8+ T cells sorted from healthy donor in (A). (C) Representative flow cytometry plot of MitoTracker Green and MitoTracker Deep Red staining in CD38hiCD8+ and CD38loCD8+ T cells from the peripheral blood of SLE patients. Percentage of depolarized mitochondria in CD38hiCD8+ and CD38loCD8+ T cells. (D and E) Representative flow cytometry plot of MitoTracker Green (D) and MitoSOX (E) staining and the mean fluorescence intensity (MFI) in CD38hiCD8+ and CD38loCD8+ T cells from lupus patient peripheral blood. (F to I) Representative electron microscopy of CD38hi with reduced number of cristae (F), no cristae (G), and CD38loCD8+ T cells (H) sorted from lupus patient peripheral blood. Percentage of mitochondria observed with partial or complete loss of cristae in CD38hiCD8+ and CD38loCD8+ T cells (I). Data are means ± SD; statistical analysis by two-tailed t test (B and F), paired t test (C to E), and chi-square test (I). **P < 0.01, ***P < 0.001.

