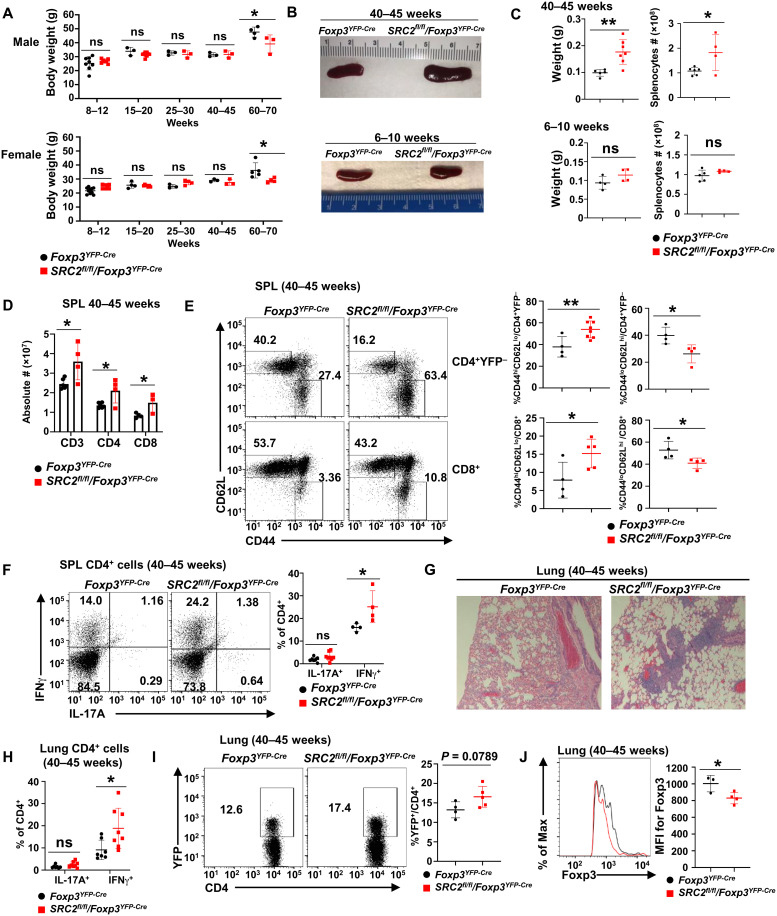
Fig. 3. Aged SRC2fl/fl/Foxp3YFP-Cre mice develop inflammation-associated lung tissue damages.
(A) Body weight measurement of indicated male (top panel) and female (bottom panel) mice at different ages (n ≥ 3 per genotype per group). (B) Representative image of spleens from older (top panel) and younger (bottom panel) mice of indicated genotypes. (C) Weight (left panels) and cellularity (right panels) of the spleens from older (top panels) and younger (bottom panels) indicated mice (n ≥ 4 per genotype per group). (D) Absolute number of CD3+, CD4+, and CD8+ T cells in the spleens from indicated older mice (n ≥ 4 per genotype per group). (E) Representative flow cytometric analysis (left panels) and percentage (right panels) of CD62L and CD44 cells among splenic CD4+YFP− or CD8+ T cells from indicated aged mice (n ≥ 4 per genotype per group). (F) Representative flow cytometric analysis (left panels) and percentage (right panel) of IL-17A+ and IFNγ+ cells among CD4+ cells from spleens of indicated aged mice (n ≥ 4 per genotype). (G) Section of hematoxylin and eosin (H&E)–stained lung from indicated aged mice. (H) Percentage of IL-17A+ and IFNγ+ cells among CD4+ cells recovered from lung of indicated aged mice (n ≥ 7 per genotype). (I) Representative flow cytometric analysis (left panels) and percentage (right panel) of Tregs (YFP+) among CD4+ cells recovered from lung of indicated aged mice (n ≥ 4 per genotype). (J) Representative flow cytometric analysis (left panel) and the MFI (right panel) for Foxp3 in Foxp3+CD4+ cells recovered from lung of indicated aged mice (n ≥ 3 per genotype). Boxed area: Cell population of interest. Data are from three experiments (A, C, D, and H; E, F, I, and J, right panels; presented as means ± SD) or are from one representative of three independent experiments (B and G; E, F, I, and J, left panels). *P < 0.05 and **P < 0.01 (two-tailed Student’s t test).

