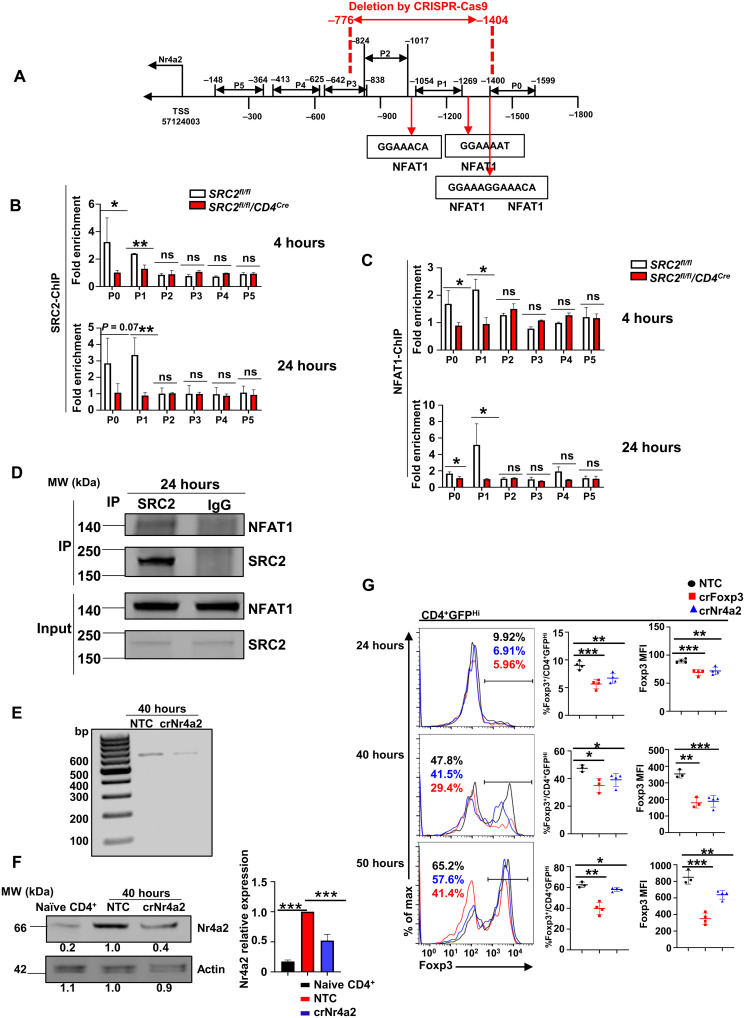
Fig. 6. SRC2 recruited by NFAT1 binds to the promoter and active gene expression of Nr4a2.
(A) Schematic representation of the six regions on Nr4a2 promoter covered by P0 to P5 primers, the locations of identified NFAT1-binding sites, and the region deleted using CRISPR-Cas9. (B and C) ChIP-qPCR analysis of SRC2 binding (B) or NFAT1 binding (C) to the Nr4a2 promoter (P0 to P5 regions) in CD4+ cells from indicated genotypes under Treg polarization at the indicated time points (n ≥ 3 per genotype per group). (D) Immunoblot analysis of NFAT1 among anti-SRC2 antibody immunoprecipitated (IP) SRC2 complexes from SRC2fl/fl CD4+ cells 24 hours after Treg polarization. Bottom blots, whole-cell lysate input control. (E) PCR analysis of the abundance of NFAT1/SRC2 binding region on Nr4a2 promoter in CD4+ cells transduced with virus expressing nontarget control (NTC) or the region containing NFAT1/SRC2-binding guiding RNAs shown in (A) (crNr4a2) and polarized under Treg condition for 40 hours. (F) Immunoblot analysis of Nr4a2 in naive CD4+ cells or CD4+ T cells transduced with virus expressing NTC and crNr4a2 shown in (E) and polarized under Treg conditions for 40 hours. The number in the bottom of the blots is the relative mean intensity of each band, and the right panel is the summary of the relative mean intensity. (G) Representative flow cytometric analysis of Foxp3 (left panels), percentages of Foxp3+ cells (middle panels), and MFI for Foxp3 (right panels) among GFPhiCD4+ cells transduced with virus expressing NTC, crFoxp3, and crNr4a2 guiding RNAs and polarized under Treg condition at the indicated time points (n ≥ 3 per treatment per group). Data are from three experiments (B, C, and F, right panels; G, middle and right panels; presented as means ± SD) or are from one representative of three independent experiments (D to G, left panels). *P < 0.05, **P < 0.01, and ***P < 0.001 (two-tailed Student’s t test). MW, molecular weight; bp, base pairs.

