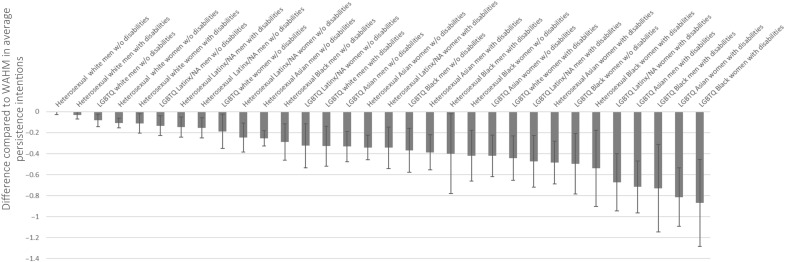
Fig. 6. Persistence intentions among STEM professionals, by intersectional demographic category, centered at mean for WAHM and arranged by size of differential from WAHM.
Predicted means for each category, holding constant variation by STEM field, employment sector, highest education, and age. Scale on the persistence intentions measure ranged from 1 (less than 5 years) to 5 (“the rest of my career”), with higher number representing stronger agreement. Values represent the average divergence of each group’s experiences from those of WAHM. Values were produced by OLS regression models with gender × race × LGBTQ status × disability status interaction terms. See the “Supplemental analysis” section in Materials and Methods for details. Error bars represent 95% confidence intervals. N = 25,324.

