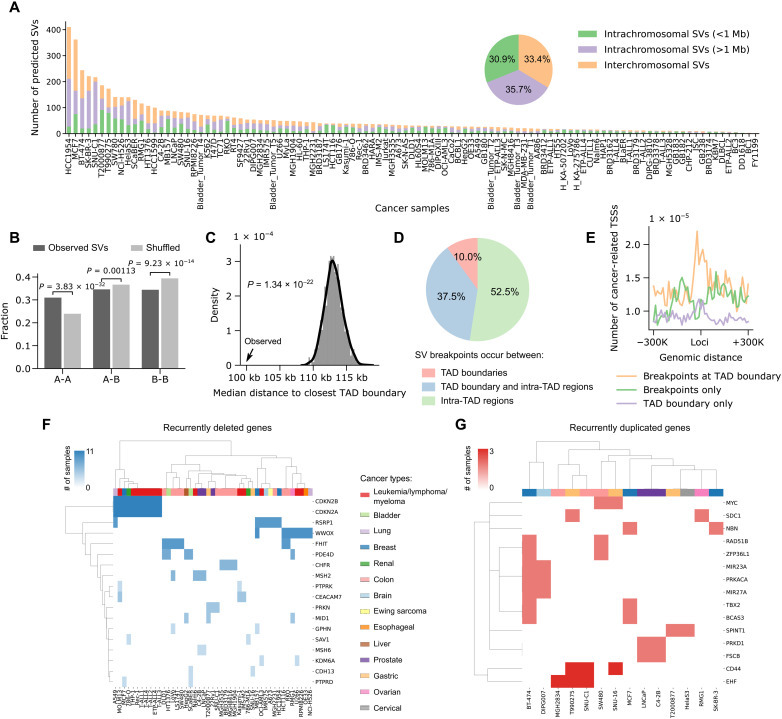
Fig. 5. Pan-cancer analysis of SVs in 105 cancer cell lines or patient samples.
(A) Number of short-range intrachromosomal SVs, long-range intrachromosomal SVs, and interchromosomal translocations predicted in each sample. The pie chart shows the percentages of different SV categories based on the data combined from all samples. (B) SVs are significantly enriched in A-to-A and depleted in B-to-B compartments compared to randomly shuffled controls. The P values were calculated using two-sided Z test. (C) SV breakpoints occur significantly closer to TAD boundaries compared to random shuffled controls. The P values were calculated using two-sided Z test. (D) Percentages of SVs with breakpoints occurring between TAD boundaries, between a TAD boundary and intra-TAD regions, and between intra-TAD regions. (E) The TSSs of cancer-related genes are specifically enriched near SV breakpoints at TAD boundaries. (F) Unsupervised clustering of recurrently deleted genes and cancer samples based on the occurrence of genes in each sample. Different cancer types are coded by different colors. (G) Similar to (F), the clustering of recurrently duplicated genes and cancer samples.

