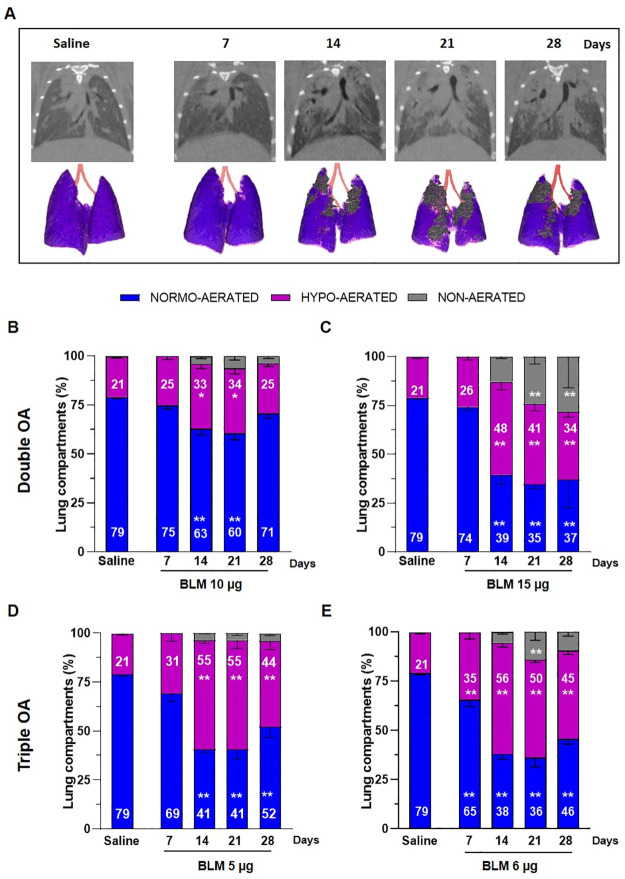
Fig 2. Longitudinal micro-CT assessment.
(A) Representative coronal micro-CT lung slices and 3D renderings at the end of expiration phase of saline- and BLM-treated mice at 7, 14, 21 and 28 days. (B-E) Lung aeration degrees expressed as percentage of normo-, hypo-, and non-aerated tissues detected at 7, 14, 21, 28 days for the saline group and BLM groups at different dose regimens. Data are shown as mean ± SEM. The statistical analysis was performed for each group compared to saline via two-way ANOVA followed by Dunnett’s test (*p<0.05; **p<0.01 vs. saline). N = 5 per group.

