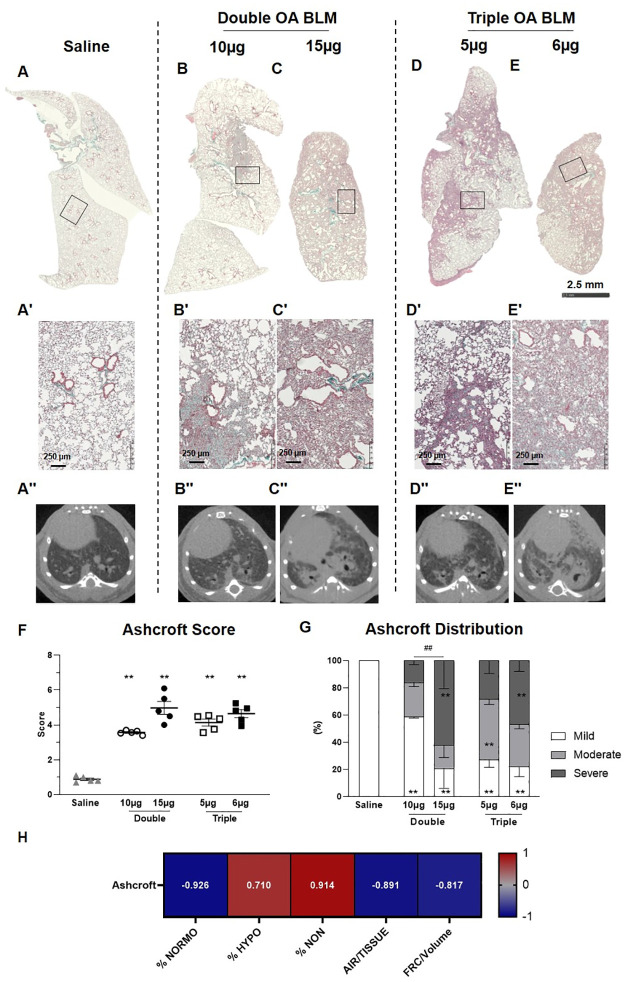
Fig 4. Histological staining.
Representative micro-photographs of saline (A), BLM-double treated groups (B, C) and BLM-triple treated groups (D, E) stained with Masson’s trichrome at day 28. The squares indicate the selected zone with higher magnification (A´-E´). Representative transversal micro-CT scans of saline (A’’), double BLM-treated groups (B’’, C’’) and triple BLM-treated groups (D’’, E’’). (F) Ashcroft score for the saline and BLM groups. (G) Ashcroft frequency distribution in saline and BLM groups. (H) Spearman’s correlation between micro-CT parameters and Ashcroft Score. Data are shown as mean ± SEM. Statistical analysis was performed between the animal groups by one-way ANOVA followed by Tukey’s test (*p<0.05, **p<0.01 vs. saline; ## p<0.01 comparing low and high doses in double and triple OA groups, respectively). N = 5 per group.

