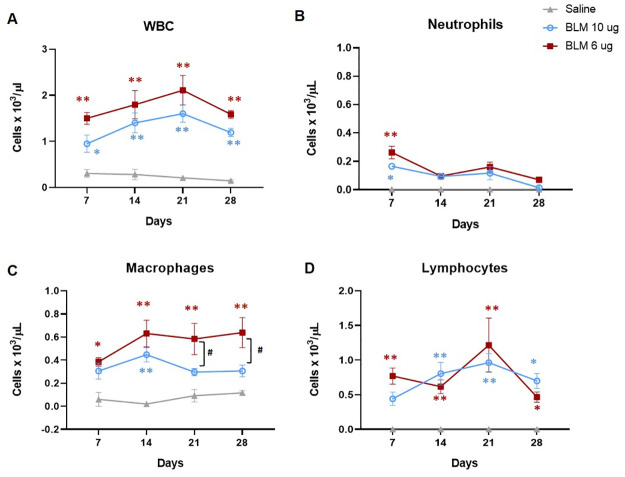
Fig 6. BAL cells count at different time-points.
Levels of total white blood cells (A), neutrophils (B), macrophages (C) and lymphocytes (D) in BALF of animals receiving saline, the double dose of 10 μg and the triple dose of 6 μg at 7, 14, 21 and 28 days. Data are shown as mean ± SEM. The statistical differences were calculated by two-way ANOVA followed by Tukey’s test (*p<0.05; ** p<0.01 vs. saline; # p<0.05 BLM 6 μg vs. BLM 10 μg). N = 5 per group per time point.

