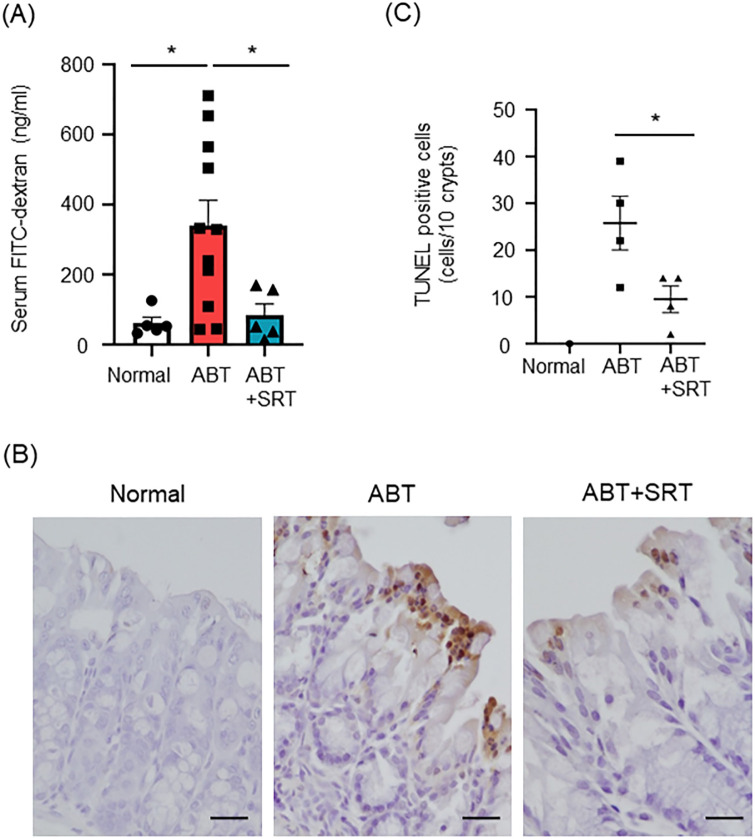
Fig 3. Effect of Saireito on antibiotic-induced colonic epithelial barrier dysfunction and cell apoptosis in the colon.
Normal group mice were given a normal diet and normal drinking water; ABT group mice were given a normal diet and A + V solution in drinking water for the last 7 days; ABT + SRT group mice were fed a 1.5% Saireito diet until the last day and given A + V solution in drinking water for the last 7 days. (A) Graph shows FITC-dextran levels in the serum of each mouse. One representative of two independent experiments (n = 5, normal group. n = 11, ABT group and n = 5, ABT + SRT group). (B) Graph shows TUNEL staining of the colon (× 400). (C) Graph shows the number of TUNEL positive apoptotic cells in each section (n = 4, each group). Data were analyzed by one-way ANOVA followed by Tukey’s multiple comparisons test and student t test. Data are shown as mean ± SEM. * P < 0.05.

