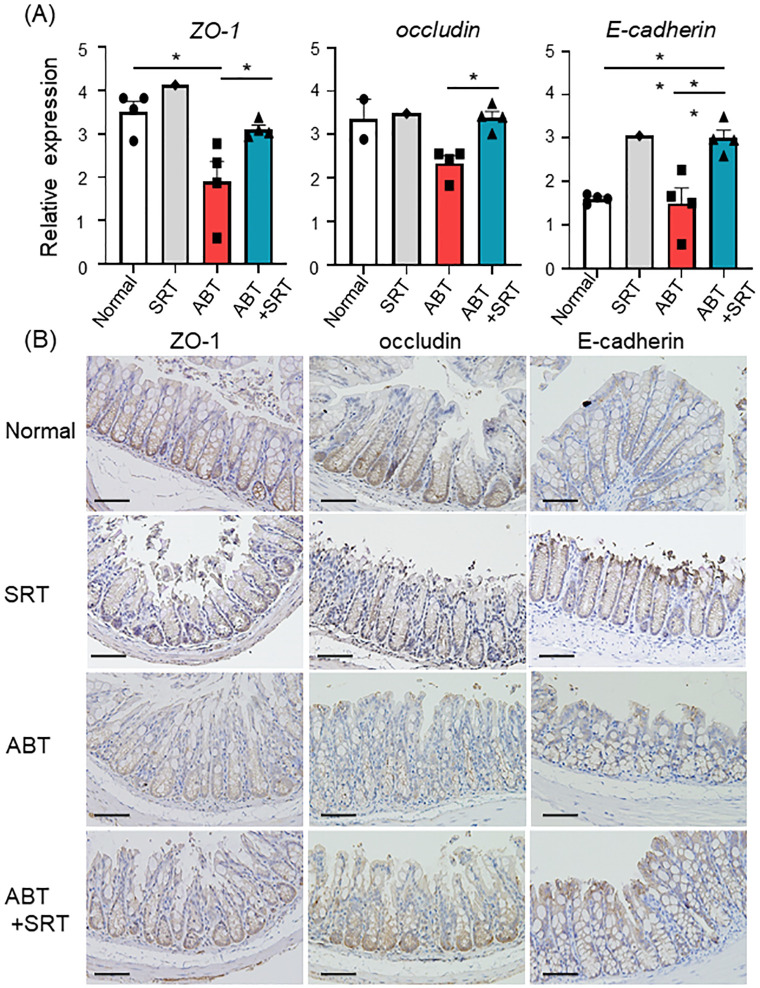
Fig 4. Effect of Saireito on expression of cell adhesion proteins.
Normal group mice were given a normal diet and normal drinking water; ABT group mice were given a normal diet and A + V solution in drinking water for the last 7 days; ABT + SRT group mice were fed a 1.5% Saireito diet until the last day and given A + V solution in drinking water for the last 7 days. (A) mRNA analysis of cell adhesion proteins. Statistical analysis was carried out using one-way ANOVA followed by Tukey’s multiple comparisons test. Data are shown as mean ± SEM (n = 4, each group). * P < 0.05, **P < 0.01. (B) The figure shows immunohistochemistry for ZO-1, occludin, and E-cadherin (×200).

