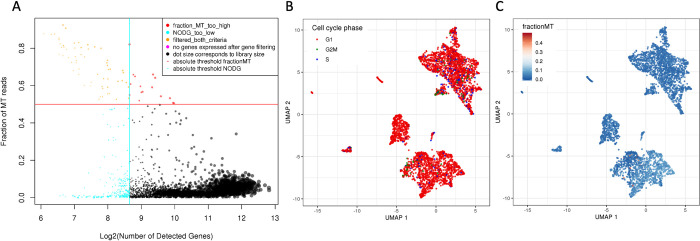
Fig 2. Examples of scAmpi’s basic scRNA-seq quality control plots of a melanoma sample.
The scatter plot in (A) shows cells colored by their respective category of applied filters. The vertical and horizontal lines indicate the chosen thresholds applied for the minimum number of genes (x-axis) and maximum fraction of reads mapping to mitochondrial genes per cell (y-axis), respectively. In (B), the UMAP embedding (after normalization) of all cells is shown, with cells colored by estimated cell-cycle phase. In (C), the same UMAP is shown, this time with cells colored by the fraction of reads mapping to mitochondrial genes.

