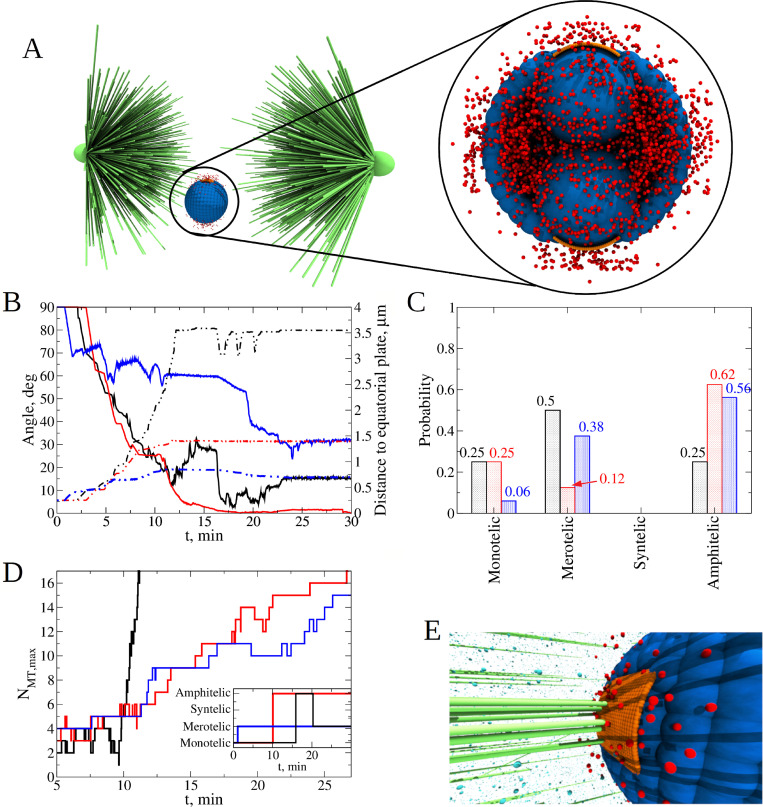
Fig 4. Exploring the role of Phosphatase and Aurora B kinase on dynamics of kinetochore-microtubule attachments.
A) Initial position and orientation of the KT pair inside the cell. The KT pair is placed close to the equatorial plate, shifted by 1.5 μm below and along the axis perpendicular to the axis of the spindle. Orientation of the KT pair axis is along the axis perpendicular to the spindle axis. The AB particles are spatially distributed around the center between the KT pair as shown in the blowout. B) Time dependent evolution of KT-KT orientation angle (solid lines; left y-axis) and distance between KT-pair and equatorial plate (dash-dotted lines, right y-axis) for the Phosphatase to Aurora B (P:AB) ratio = 1:100 (blue), 1:10 (red), and 1:1 (black). Each curve shows results from a single simulation run. C) Probability to find each type of attachment for different P:AB ratio = 1:100 (blue bars), 1:10 (red bars), and 1:1 (black bars). Statistics was collected from n = 8 independent runs for each of these three cases. D) The P:AB ratio influences the average bond lifetime and the frequency of attachment-detachment switches. Shown is evolution of the maximum number of microtubules (MTs) attached to a single KT from a single centrosome for P:AB ratio = 1:100 (blue lines), 1:10 (red) and 1:1 (black) during 30 min of simulation. Changes in the KT-MT attachment status are shown in the inset. E) Snapshot of the final state of the system (red and cyan spheres are particles of Aurora B kinase and Phosphatase).

