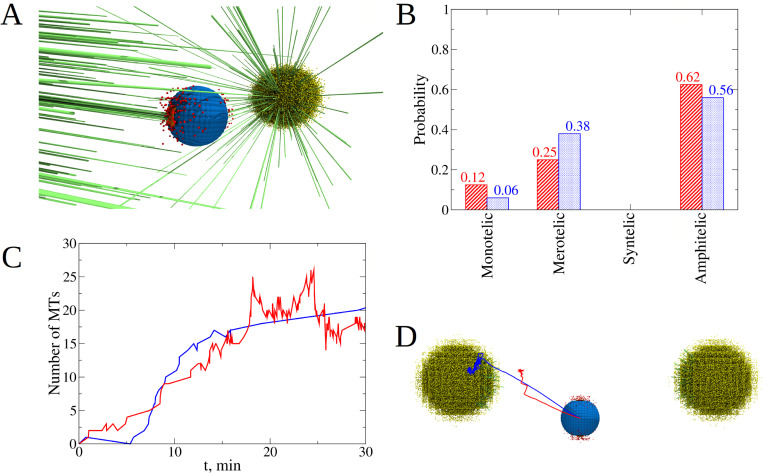
Fig 5. Exploring the effect of the Aurora A presence.
A) Snapshot of the final KT pair position and orientation (amphitelic attachment) for a simulation with AA. B) Probability to find each type of attachment for the system without AA (blue bars) and for the system with AA (red bars). Statistics were collected from n = 20 simulation runs for both cases. C) Addition of AA kinases to the system changes the Phosphatase to Aurora B ratio close to centrosomes (CSs). This influences the average bond lifetime and the frequencies of attachment/detachment switches. Blue line shows the evolution of total number of microtubules (MTs) attached to a single KT pair from both CSs for the case study without AA, red line shows the number of MTs for the case study with AA. D) An example of how adding AA kinases to the system corrects the trajectory of the KT pair. Lines show the 2D projection (xz-plane) of the KT pair trajectory during 30 min simulations. For the case study without AA (blue line), KT pair reaches one of the CSs and for the case study with AA (red line), KT pair stops right before the cloud of AA kinases.

