
Figure 3: Longitudinal information for case 47.
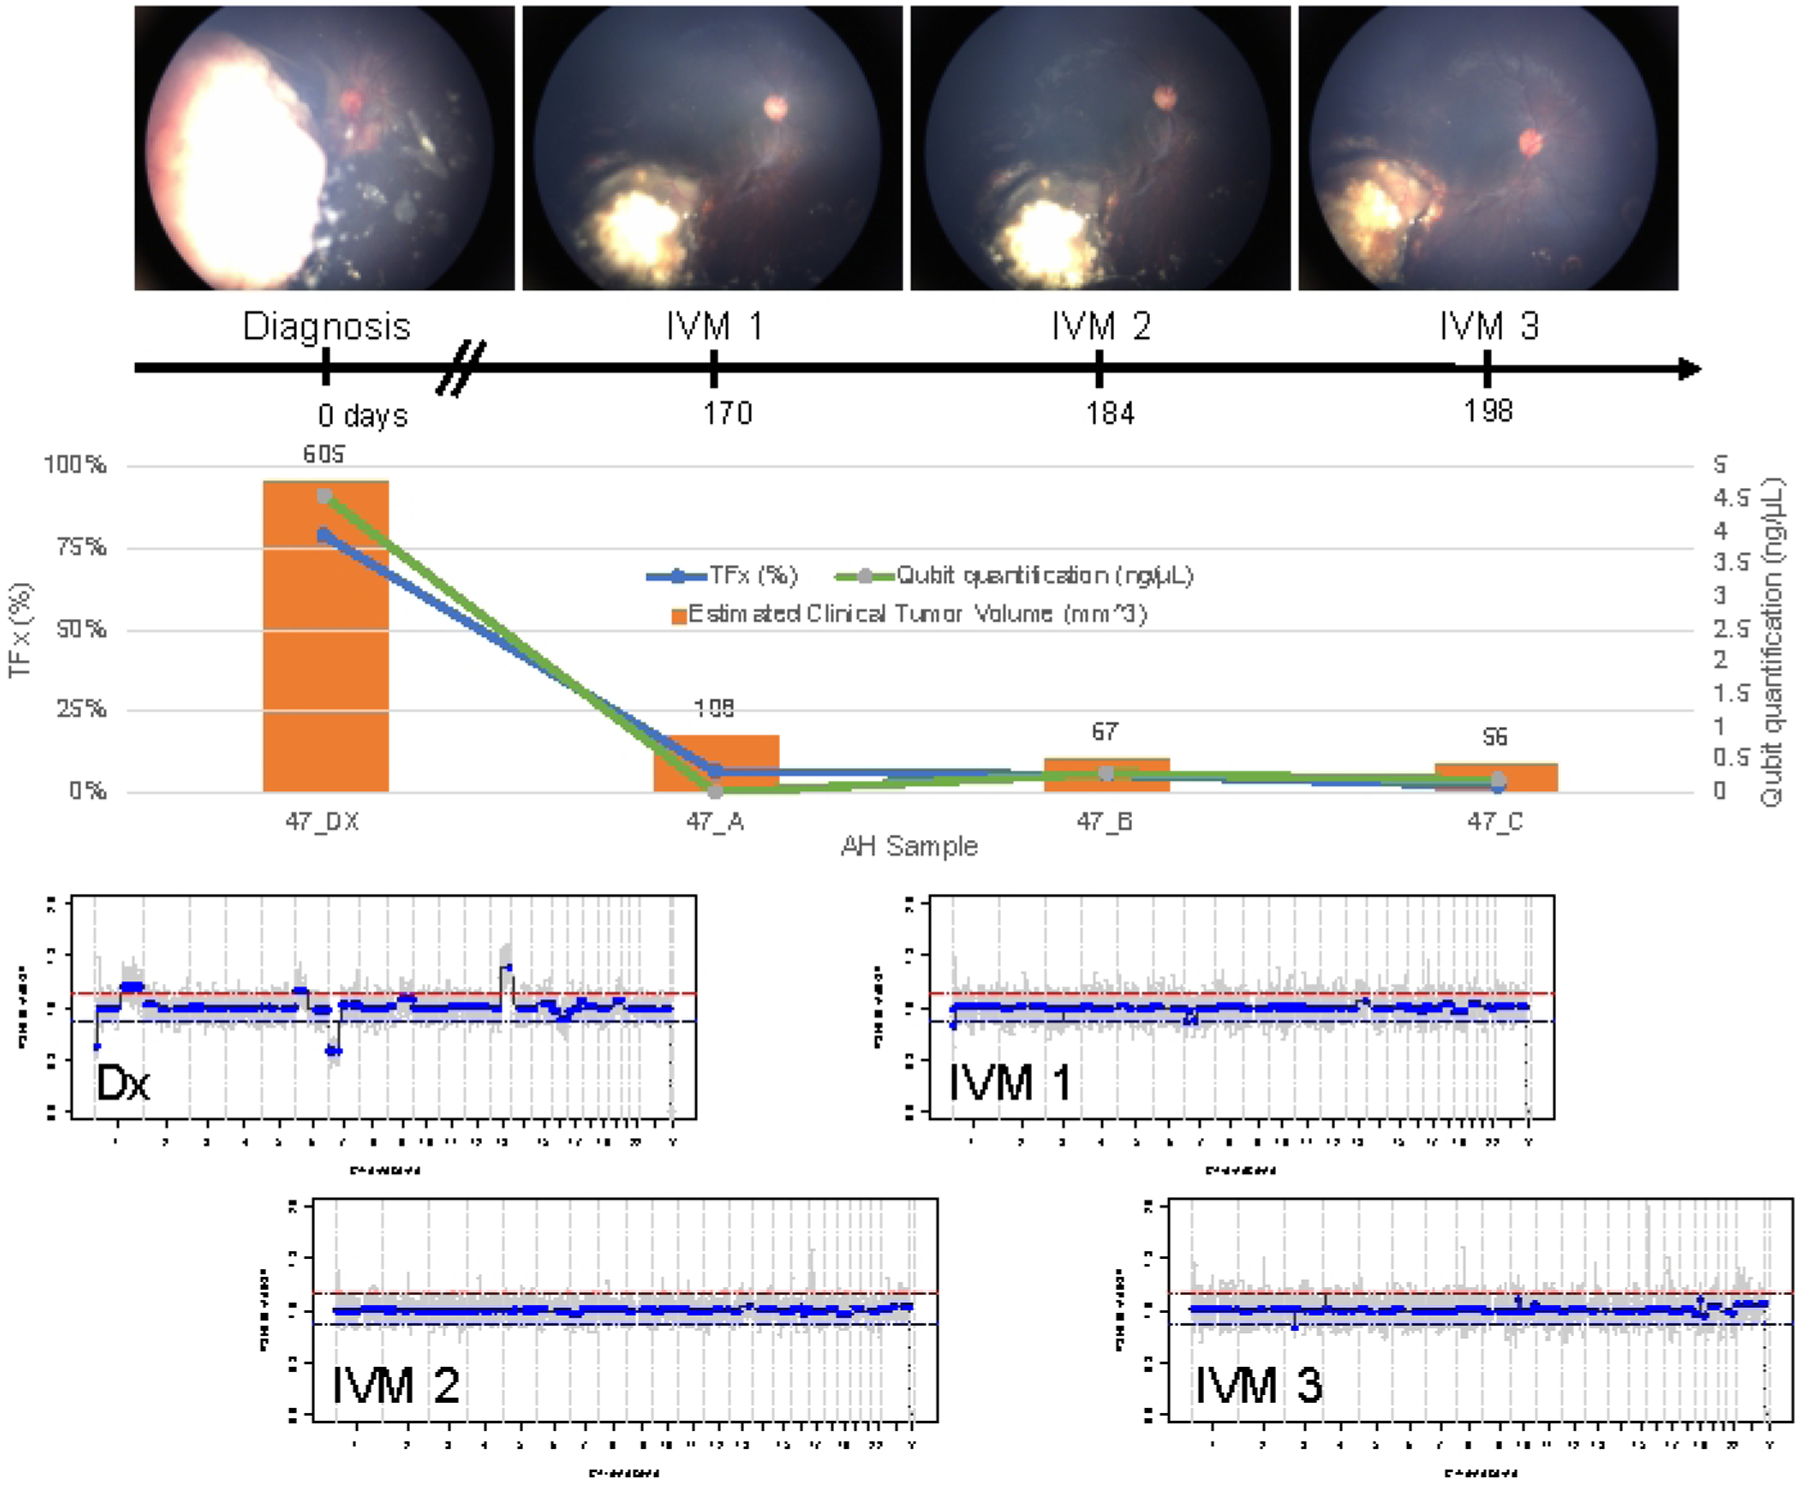
This includes fundus photos, cfDNA quantification, estimated clinical tumor volume from B-scan measurements, genomic profiles, and TFx estimations for each clinical time point at which AH was sampled (Dx = diagnosis, A = IVM1, B = IVM2, C = IVM3). This eye responded to treatment and remained salvaged at 19 months of follow-up. A decrease in cfDNA quantity was observed over time, consistent with previously published studies showing the highest yield obtained at diagnosis. TFx also decreased over treatment, reflecting the resolution of seeding and the decrease in the main retinal tumor volume (tumor volumes are indicated above each clinical time point’s orange bar). As expected with clinical regression of the disease, genomic profiles normalized as well. In the genomic profiles, the red line represents the threshold for a gain, while the blue line represents the threshold for a loss. This figure has been reprinted with permission from Xu, L. et al.21.