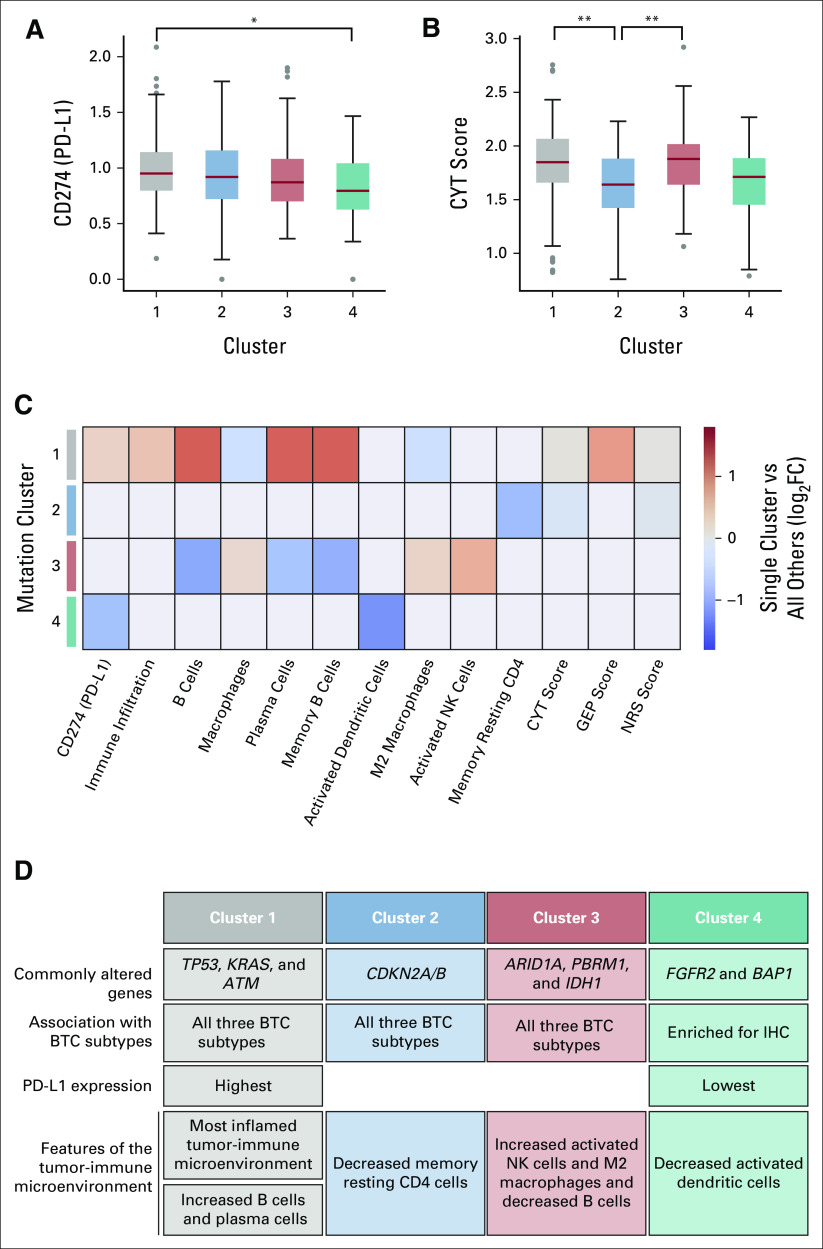
FIG 2.
Cluster-biomarker associations (N = 454). (A) PD-L1 gene expression and (B) CYT scores for each of the four driver gene–defined clusters identified in Figure 1 (significant pairwise associations were assessed via the Mann-Whitney U test; *P < .01 and **P < .001 after correcting for multiple comparisons). (C) Immune-related biomarkers for which the Mann-Whitney U test showed significant differences across clusters (P < .01). For visualization, each box is colored according to the log-fold change between the single cluster when compared across aggregated values from all other clusters. Red denotes that the cluster had higher biomarker scores, whereas blue denotes lower. (D) Summary of cluster-defining features. BTC, biliary tract cancer; CYT, cytolytic activity; GEP, T-cell inflamed gene expression profile; IHC, intrahepatic cholangiocarcinoma; PD-L1, programmed death-ligand 1; NK, natural killer; NRS, neoadjuvant response signature.

