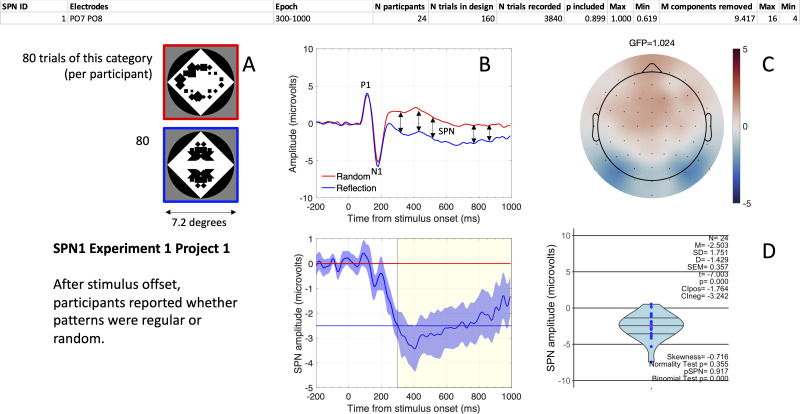
Figure 2. The first SPN from the SPN Gallery.
(A) Examples of stimuli. (B). Grand-average ERP waves from electrodes PO7 and PO8 (upper panel), and the SPN as a reflection-random difference wave (with 95% CI; lower panel). The typical 300–1000ms SPN window is highlighted in yellow. Mean amplitude during this window was –2.503 microvolts (horizontal blue line). (C) SPN as a topographic difference map. (D) Violin plot showing SPN amplitude for each participant plus descriptive and inferential statistics. The file “One SPN Gallery.pdf” (https://osf.io/eqhd5/) contains a figure like this for all 249 SPNs. The analysis details shown at the top of the figure are also explained in this file.

