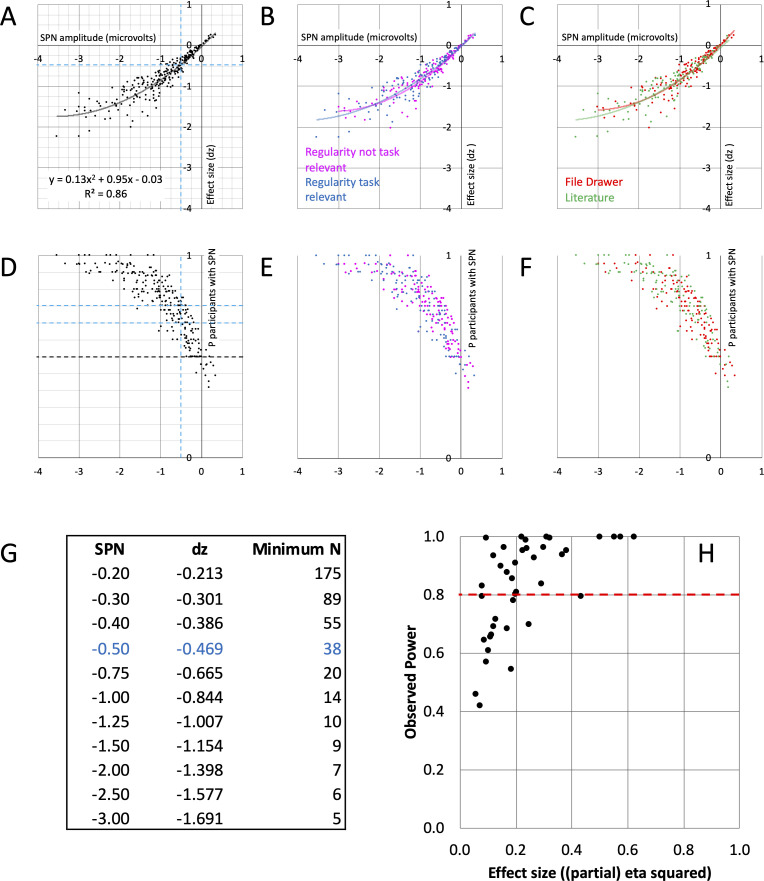
Figure 4. SPN effect size and power.
(A–C) The nonlinear relationship between SPN amplitude and effect size. The equation for the second order polynomial trendline is shown in panel A (y = 0.13x2+0.95 x - 0.03). This explains 86% of variance in effect size (R2=0.86). Using the equation, we can estimate effect size for an SPN of a given amplitude. Dashed lines highlight –0.5 microvolt SPNs, with average effect size dz of –0.469. For an 80% chance of finding this effect, an experiment requires 38 participants. The relationships were similar whether regularity was task relevant or not (B), and in published and unpublished work (C). (D–F) How many participants show the SPN? The larger (more negative) the SPN, the more individual participants show the effect (regular < random). Dashed lines highlight –0.5 microvolt SPNs, which are quite often present in 2/3 but not 3/4 of the participants. The relationships were similar whether regularity was task relevant or not (E), and in published and unpublished work (F). (G) Table of required N for 80% chance of obtaining an SPN of a given amplitude. (H) Observed power and effect size of 40 SPN modulations. 15/40 do not reach the 0.8 threshold (red line).

