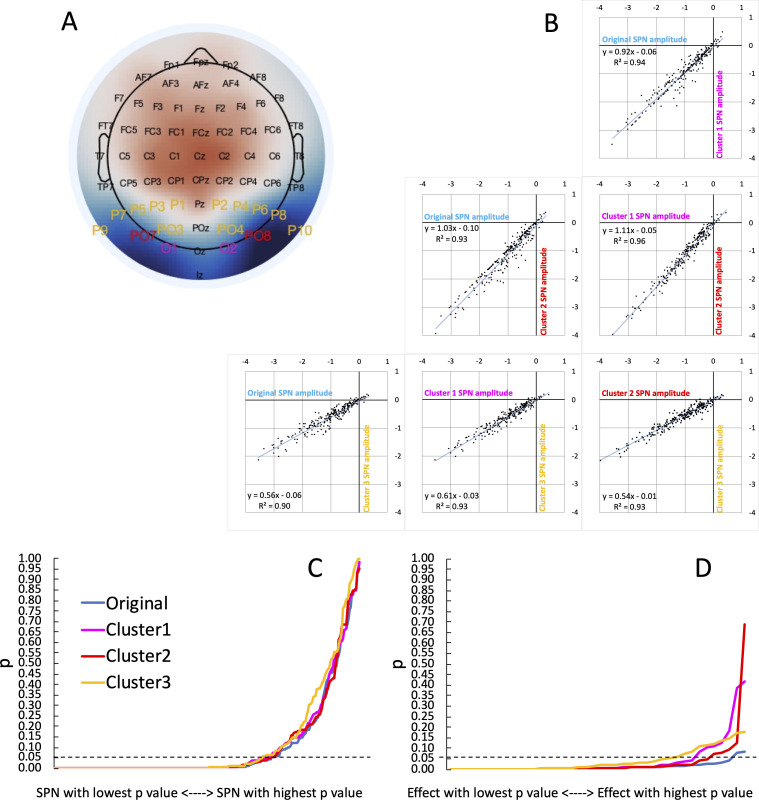
Figure 5. Vibration of the SPN effect.
(A) Typical SPN topographic difference map with labels colour coded to show three alternative electrode clusters, which could have been used dogmatically in all analyses, whatever the observed topography. (B) Scatterplots show SPNs from the original cluster and the three alternatives, which are highly correlated. (C) One-sample t-tests were used to establish whether each SPN is significant. The cumulative distribution of p values is shown here. The smallest p value (from the most significant SPN) is at the left-most end of the x axis, and the largest p value (from the least significant SPN) is at the right-most end. The p values from the original cluster and the three alternatives were very similar. There was a similar number of significant SPNs (169–177). (D) ANOVAs are used to assess SPN modulations. The p values from 40 representative ANOVA effects do not overlap completely. There were more significant SPN modulations when the original electrode cluster was used than any alternative (38 vs 35–29).

