. 2022 May 13;11:e64430. doi: 10.7554/eLife.64430

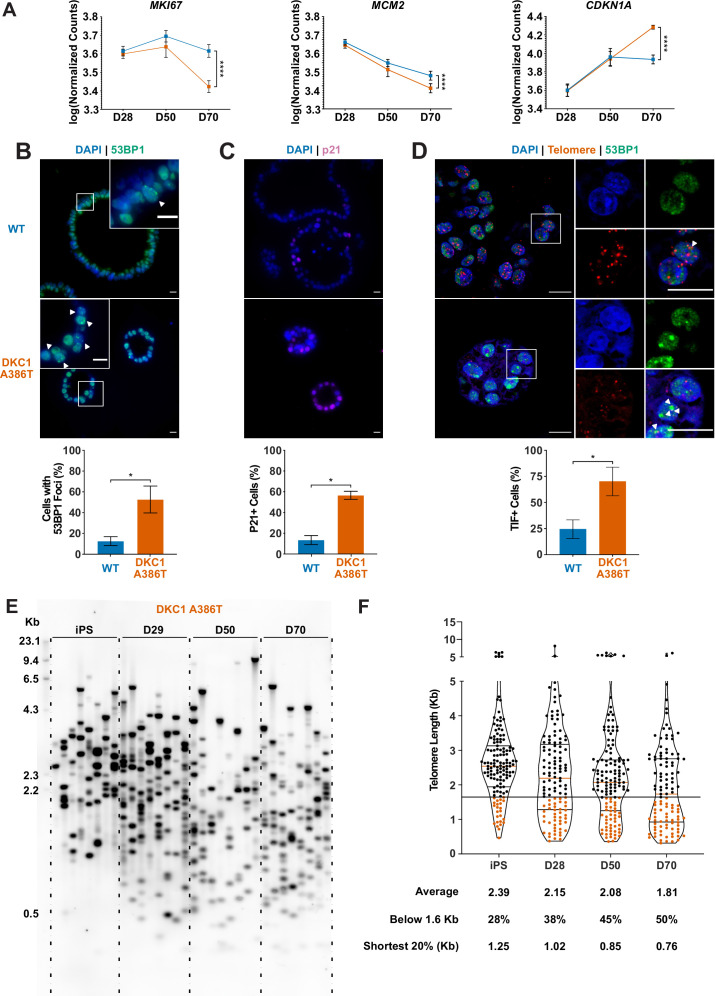
Figure 2. Dyskeratosis congenita induced pluripotent stem cell-derived type II alveolar epithelial cells (iAT2s) 35 passages after introduction of the mutation at D70 show hallmarks of senescence.

(A) Gene expression profiling of iAT2 cells at D28 and D50 shows no difference between wild type and DKC1 A386T in expression of markers of proliferation and a cell cycle inhibitor, while at D70 cells, there is a significant decrease in MCM2 and MKI67 as well as a significant increase in CDKN1A (p21) (n = 4, **** p<0.0001, DEseq2 pairwise contrast statistics). (B) At D70, DKC1 A386T mutant iAT2 cells have a higher fraction of cells with 53BP1 foci (n = 4, * p<0.05, and Student’s t-test; scale bars, 10 µm; insets highlight cells with 53BP1 foci as noted by the white arrowheads). (C) At D70, DKC1 A386T mutant iAT2s have a higher fraction of cells positive for p21 (n = 4, * p<0.05, and student’s t-test; scale bars, 10 µm). (D) At D70, DKC1 A386T mutant iAT2s have a higher fraction of cells with telomere dysfunction induced foci (TIFs) (n = 4, * p<0.05, and Student’s t-test; scale bars, 10 µm; insets highlight cells with TIFs, each one noted by a white arrowhead). (E) Representative TeSLA of DKC1 A386T iAT2 alveolospheres shows telomeres shorten with passage. (F) Quantification of DKC1 A386T iAT2 cell telomere lengths shows a preponderance of short telomeres appears as the iAT2 cells approach D70, red colored data points highlight telomeres under the 1.6 kb threshold (n = 2, ‘shortest 20%’ reports the 20th percentile of telomere length, in Kb).

Figure 2—source data 1. Source data for Figure 2.
Figure 2A-SourceData-iAT2-SenescentGeneExpression.pzfx – Raw counts from RNA-seq of induced pluripotent stem cell-derived type II alveolar epithelial cells over the differentiation specifically looking at specific senescence related genes.
Figure 2B-SourceData-53BP1PositiveCounts.pzfx – Raw counts of 53BP1 positive cells along with statistics. Figure 2C-SourceData-p21PositiveCounts.pzfx – Raw counts of p21 positive cells along with statistics. Figure 2D-SourceData-TIFPhenotype.pzfx – Raw counts of telomere dysfunction induced foci positive cells along with statistics. Figure 2E,F-SourceData-2020-08-31-TeSLABlotMerged-Cropped.tiff – Uncropped raw image of TeSLA blot along the differentiation showing where the crop was placed for Figure 2E. This is the same blot as used in Figure 4—figure supplement 3B. Figure 2E,F-SourceData-2020-08-31-TeSLABlotMerged.tiff – Uncropped raw image of TeSLA blot along the differentiation showing where the crop was placed for Figure 2E. This is the same blot as used in Figure 4—figure supplement 3B. Figure 2E,F-SourceData-TeSLADKC1A386TAlongDiff.pzfx – Raw counts from TeSLA quant software analysis of cropped blot looking at telomere length along the differentiation along with statistical analysis.

Figure 2.

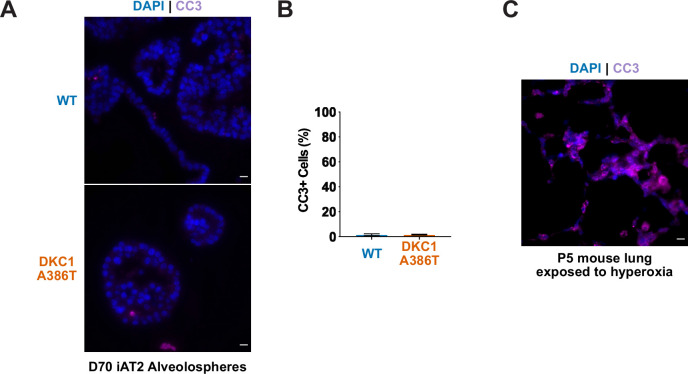
Figure 2—figure supplement 1. Dyskeratosis congenita induced pluripotent stem cell-derived type II alveolar epithelial cells (iAT2s) 35 passages after introduction of the mutation at D70 do not show an increase in apoptosis.

Figure 2—figure supplement 1.

(A) Representative images and quantification of CC3 staining at D70 show no significant difference between wild type (WT) and DKC1 A386T mutant iAT2 alveolospheres. (B) Quantification of CC3+ cells in D70 iAT2 alveolospheres (n = 4, no difference, p=0.96, student’s t-test; scale bars, 10 µm). (C) CC3 positive control: day 0 postnatal lung from a mouse exposed to hyperoxia (panel on right) served as a positive control for CC3 staining.
Figure 2—figure supplement 1—source data 1. Source data for Figure 2—figure supplement 1C.
Figure 2—figure supplement 1-SourceData-CC3Counts.pzfx – Raw counts of CC3 positive cells along with statistics.
Figure 2—figure supplement 2. Telomere qPCR reveals a trend toward shorter average telomere lengths in dyskeratosis congenita (DC) induced pluripotent stem cell-derived type II alveolar epithelial (iAT2) cells.
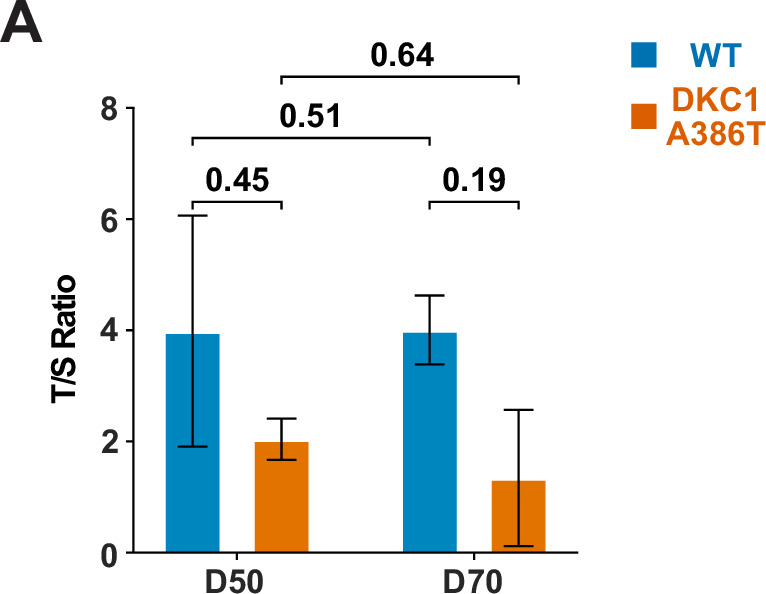
Figure 2—figure supplement 2.

(A) Average telomere length as measured by telomere qPCR of wild type (WT) and DC iAT2 cells with passage (n = 2, p-values listed on the figure, Student’s t-test).
Figure 2—figure supplement 2—source data 1. Source data for Figure 2—figure supplement 2.
Figure 2—figure supplement 2-SourceData-TelomereqPCR.pzfx – Raw Cq values from telomere qPCR for measuring average telomere lengths.