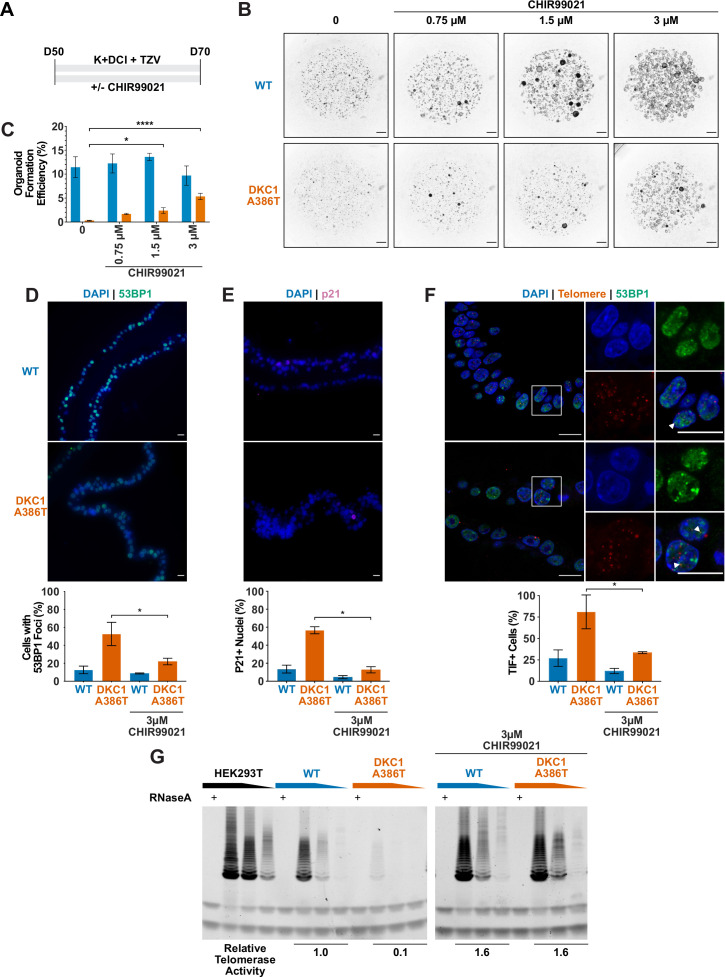
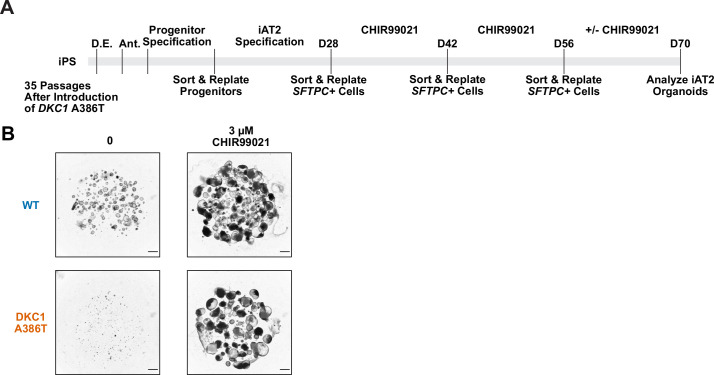
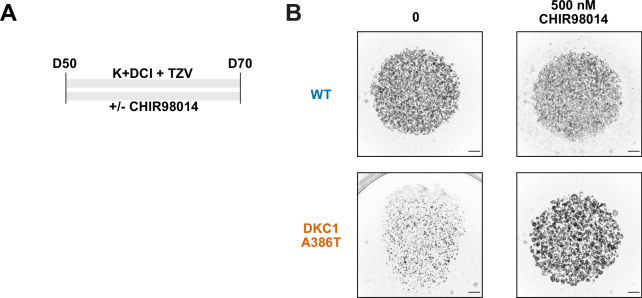
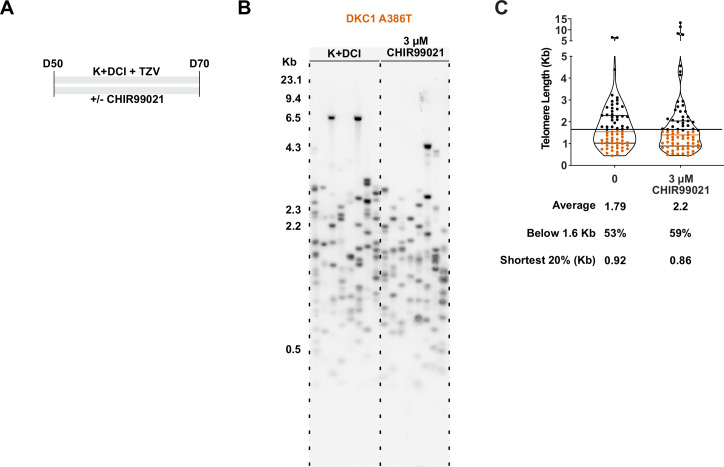
Figure 4. CHIR99021 rescues growth and telomere defects in dyskeratosis congentia (DC) induced pluripotent stem cell-derived type II alveolar epithelial (iAT2) cell alveolospheres.
(A) Differentiation protocol used to test how CHIR99021 affects growth of DC iAT2s. (B) Representative images of differentiating wild type (WT) and DKC1 A386T mutant bearing cells with increasing amounts of CHIR99021 (scale bars, 1 mm for all alveolosphere images). (C) Quantifications of alveolosphere formation efficiency after treatment with differing concentrations of CHIR99021 (n = 4, * p<0.05, **** p<0.0001, Student’s t-test). (D) When D70 alveolospheres are cultured with 3 µM CHIR99021, DKC1 A386T mutant iAT2 cells have a lower fraction of cells with 53 BP1 foci. Note, data for no CHIR99021 bars are from Figure 2 (n = 3, * p<0.05, Student’s t-test; scale bars, 10 µm). (E) When D70 alveolospheres are cultured with 3 µM CHIR99021, DKC1 A386T mutant iAT2 cells have a lower fraction of p21 positive cells. Note, data for no CHIR99021 bars are from Figure 2 (n = 3, * p<0.05, Student’s t-test; scale bars, 10 µm). (F) When D70 alveolospheres are cultured with 3 µM CHIR99021, DKC1 A386T mutant iAT2 cells have a lower fraction of telomere dysfunction induced foci (TIF) positive cells. Note, data for no CHIR99021 bars are from Figure 2 (n = 3, * p<0.05, Student’s t-test; scale bars, 10 µm; insets highlight cells with TIFs, each one noted by the white arrowheads). (G) Telomeric repeat amplification protocol assay for telomerase activity in iAT2 cells using fivefold extract dilutions (n = 3).


