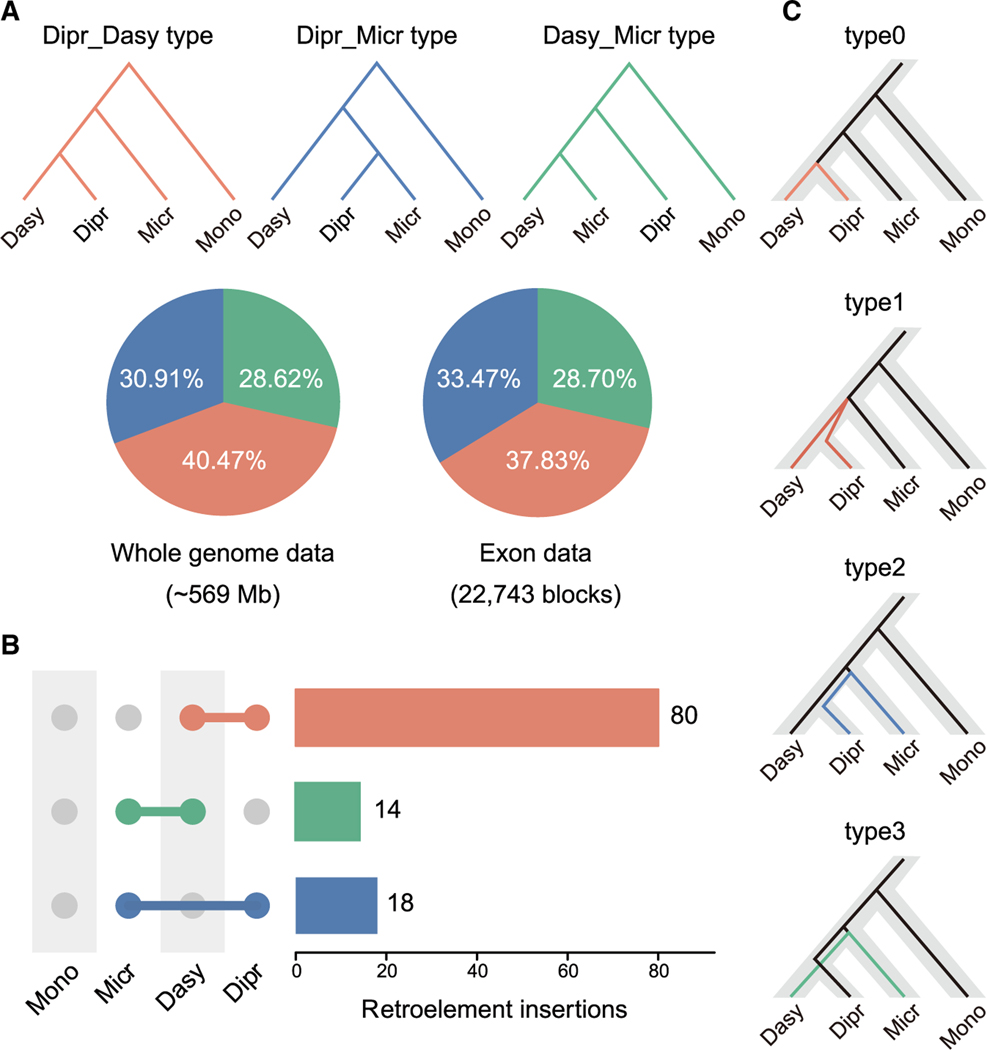
Figure 2. Pervasive signatures of incomplete lineage sorting in marsupial genomes.
(A) Discordance between gene trees and species tree in WGAs and exon blocks. Red branches and sectors represent genomic regions for which the gene tree topology is same as the species tree (Dipr_Dasy), blue branches and sectors represent regions supporting Diprotodontia and Microbiotheria as sister taxa (Dipr_Micr), and green branches and sectors represent regions whose topology supports Dasyuromorphia and Microbiotheria as closest relatives (Dasy_Micr).
(B) Presence/absence status of retroelements in marsupials. The horizontal bars represent the number of retroelements that were exclusively found in a specific combination of species shown on the left. The gray circles indicate absence of retroelements markers, whereas colored circles indicate presence. The red bar indicates that the presence pattern of retroelements markers supported the species tree, whereas the blue bar supported the Dipr_Micr tree and the green bar supported the Dasy_Micr tree. A similar number of TEs supported Dipr_Micr or Dasy_Micr as expected when created by ILS.
(C) Four potential genealogy scenarios for each locus in CoalHMM analysis.
The standard relationship (species tree, non-ILS) was designated as type0 (without deep coalescence) and type1 (with deep coalescence), and two alternative genealogies, type2 (Dipr and Micr are closest relatives) and type3 (Dasy and Micr are closest relatives), represent two alternative ILS scenarios. Color coding is the same as in (A). Dasy, Dasyuromorphia; Dipr, Diprotodontia; Micr, Microbiotheria (monito del monte); Mono, M. domestica.
See also Figures S2 and S3.

