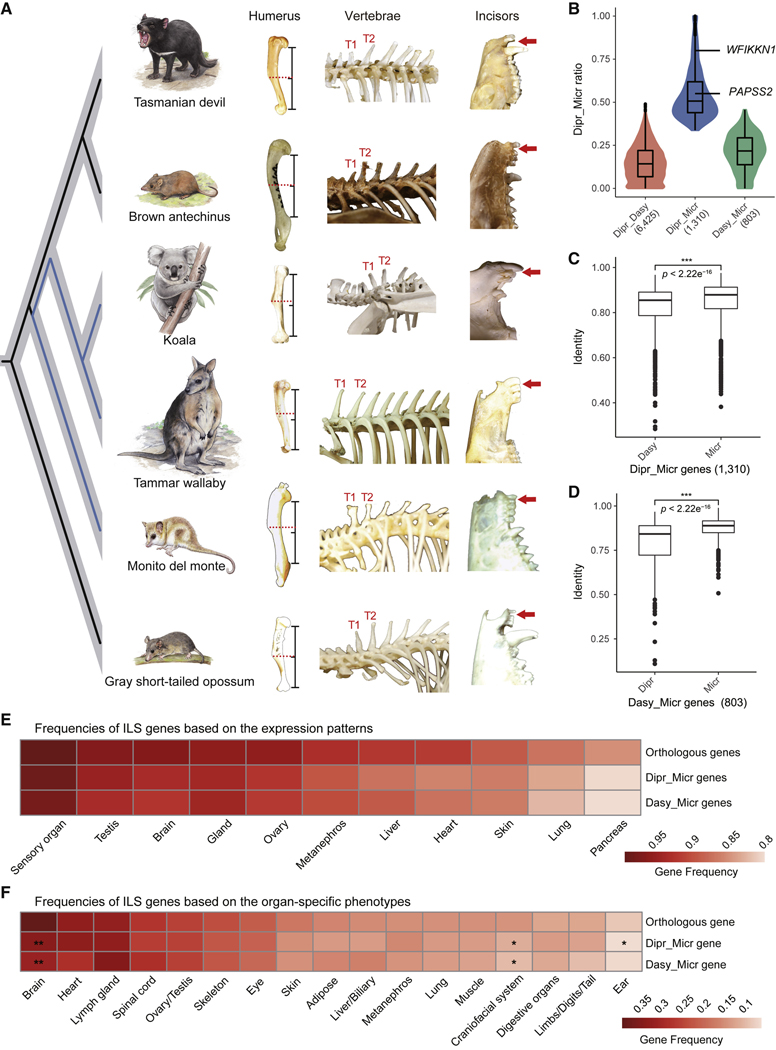
Figure 4. ILS genes and their potential phenotypic effects.
(A) Three representative morphological traits showing similar patterns of variation between the monito del monte and diprotodontian species (blue branches) although they are not sister lineages. For the humerus, curvature of the humerus in the monito del monte and both diprotodontian species is much shallower than in both dasyuromorphian species and the gray short-tailed opossum. Red dashed lines highlight the position of the position where the curvature changed most significantly compared with the middle point of the line segment. Here, the line segment is from the posterior margin of the head to the first intersection at which the bone made contact with the vertical plane. For the vertebrae, the spinous process of T1 thoracic vertebra is shorter than the spinous process of T2 in the brown antechinus, Tasmanian devil, and the gray short-tailed opossum but similar in the monito del monte, koala, and tammar wallaby. For incisors, the red arrows indicate the presence and absence of a gap.
(B) Distribution of ILS sites across the three types of genes (6,425 Dipr_Dasy, 1,310 Dipr_Micr, and 803 Dasy_Micr), expressed in proportion to the Dipr_Micr ILS loci in the coding regions of each gene. Compared with the other two types of genes, Dipr_Micr genes (blue) enriched more Dipr_Micr ILS loci. The two Dipr_Micr genes (WFIKKN1 and PAPSS2) used in our transgenic experiments are labeled and the number of genes in each category is given below the axis.
(C) Among 1,310 Dipr_Micr genes, the sequence identity between the diprotodontian species and monito del monte (Micr) was significantly higher than between Australian groups (Dasy) (Welch two sample t test, p value < 2.2e–16).
(D) Among 803 Dasy_Micr genes, the sequence identity between the dasyuromorphian species and monito del monte (Micr) was significantly higher than between Australian groups (Dipr) (Welch two sample t test, p value < 2.2e–16).
(E) Frequencies of ILS genes based on their expression patterns at the organ level (annotated by the Gene Expression Database), shown as a proportion of the total number of genes with matchings in database annotated for each organ. Chi-square test showed that the frequencies between ILS genes and all orthologs were significantly different for most organs, except for Dasy_Micr genes in the gland organ.
(F) Frequencies of ILS genes related to 17 organ-specific phenotypes, expressed as a proportion of the total number of genes annotated as being instrumental for these organ systems. Chi-square test showed that the gene frequencies between ILS genes and orthologs were not significantly different for most organ systems, except for Dipr_Micr genes in the brain, craniofacial system, and ear, and Dasy_Micr genes in the brain and craniofacial system. The center lines in boxplots (B–D) represent the median with the 25th and 75th percentiles marked by the box limits. The bars extend to the farthest data points and the dots outside of the bars are outliers. *p value < 0.05; **p value < 0.01; ***p value < 0.001. See also Figure S4 and Table S4.

