. 2022 Jun 15;12(28):17765–17783. doi: 10.1039/d2ra01570f

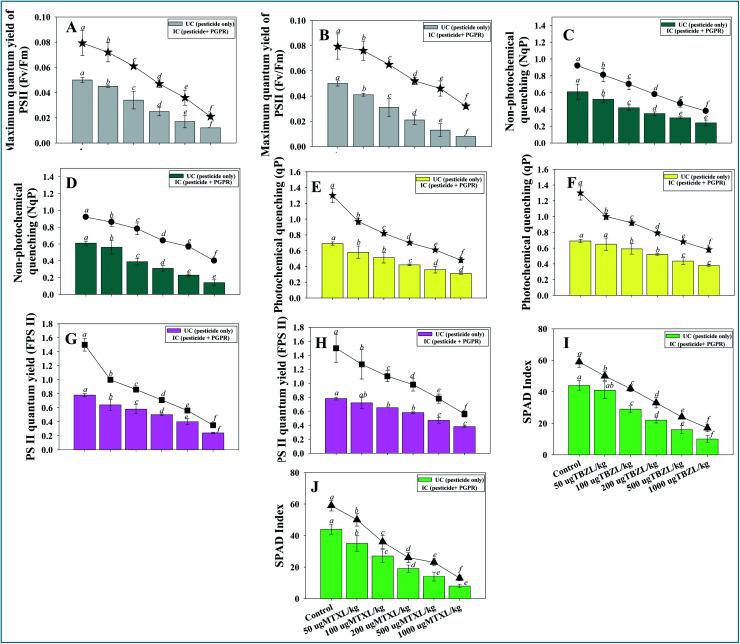
Fig. 3. Bio-inoculation effect of pesticide-tolerant Pseudomonas sp. on measurement of physiological status (chlorophyll fluorescence); maximum quantum yield of PSII (A and B), non-photochemical quenching (C and D), photochemical quenching (E and F), PSII quantum yield (G and H) and SPAD index (I and J) of V. radiata (L.) leaf exposed to 50, 100, 200, 500 and 1000 μg kg−1 soil with tebuconazole and metalaxyl. Here, bar and line diagrams represent the mean values of three replicates (n = 3) of three plants/pot. Mean values followed by different letters are significantly different (p ≤ 0.05) as determined by DMRT test. Vertical and scattered bars represent means ± SDs (n = 3).

Fig. 3