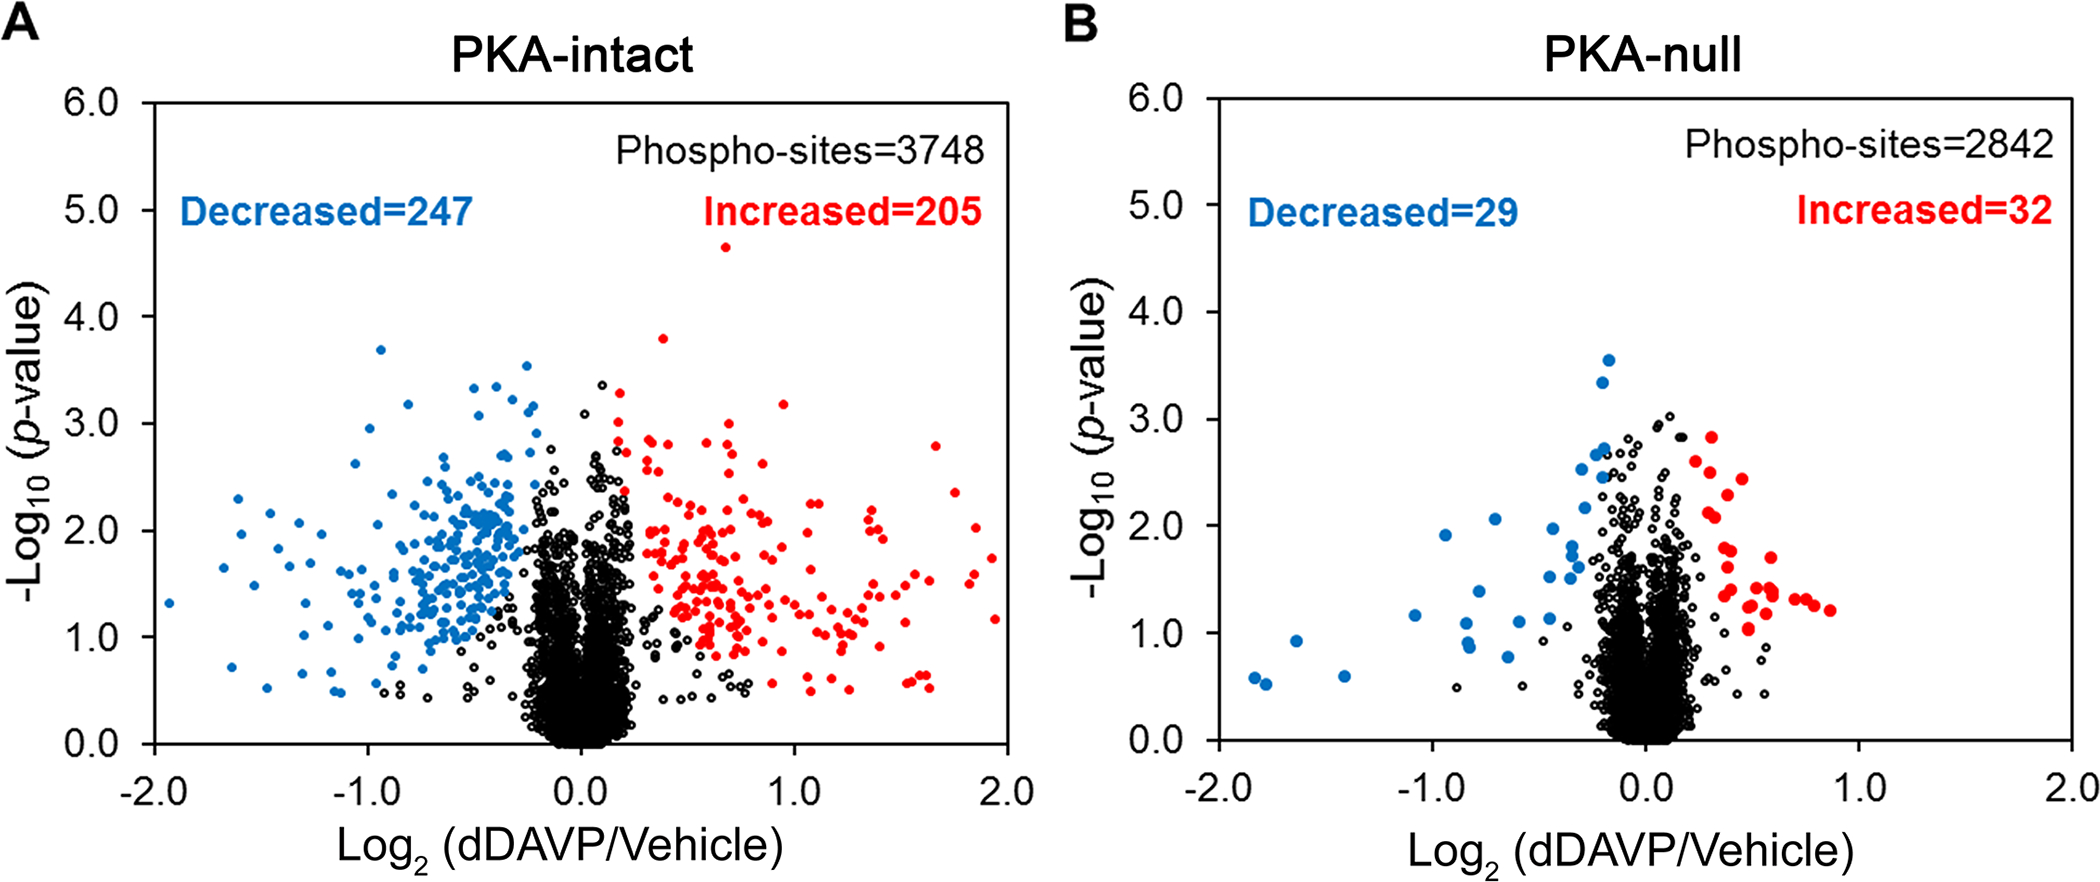
Figure 3.

Volcano plot for single and unique phosphorylation sites quantified with a consistent trend across all three pairs (dDAVP vs. vehicle) of (A) PKA-intact and (B) PKA-null clones. Phosphosites having a site-assignment probability >80% as determined by PhosphoRS 3.0 were used for this analysis. The red and blue dots indicate increased and decreased phosphorylation sites with Pfp ≤0.01. The plots were presented with an x-axis value of −2.0 to +2.0 for better visualization.
