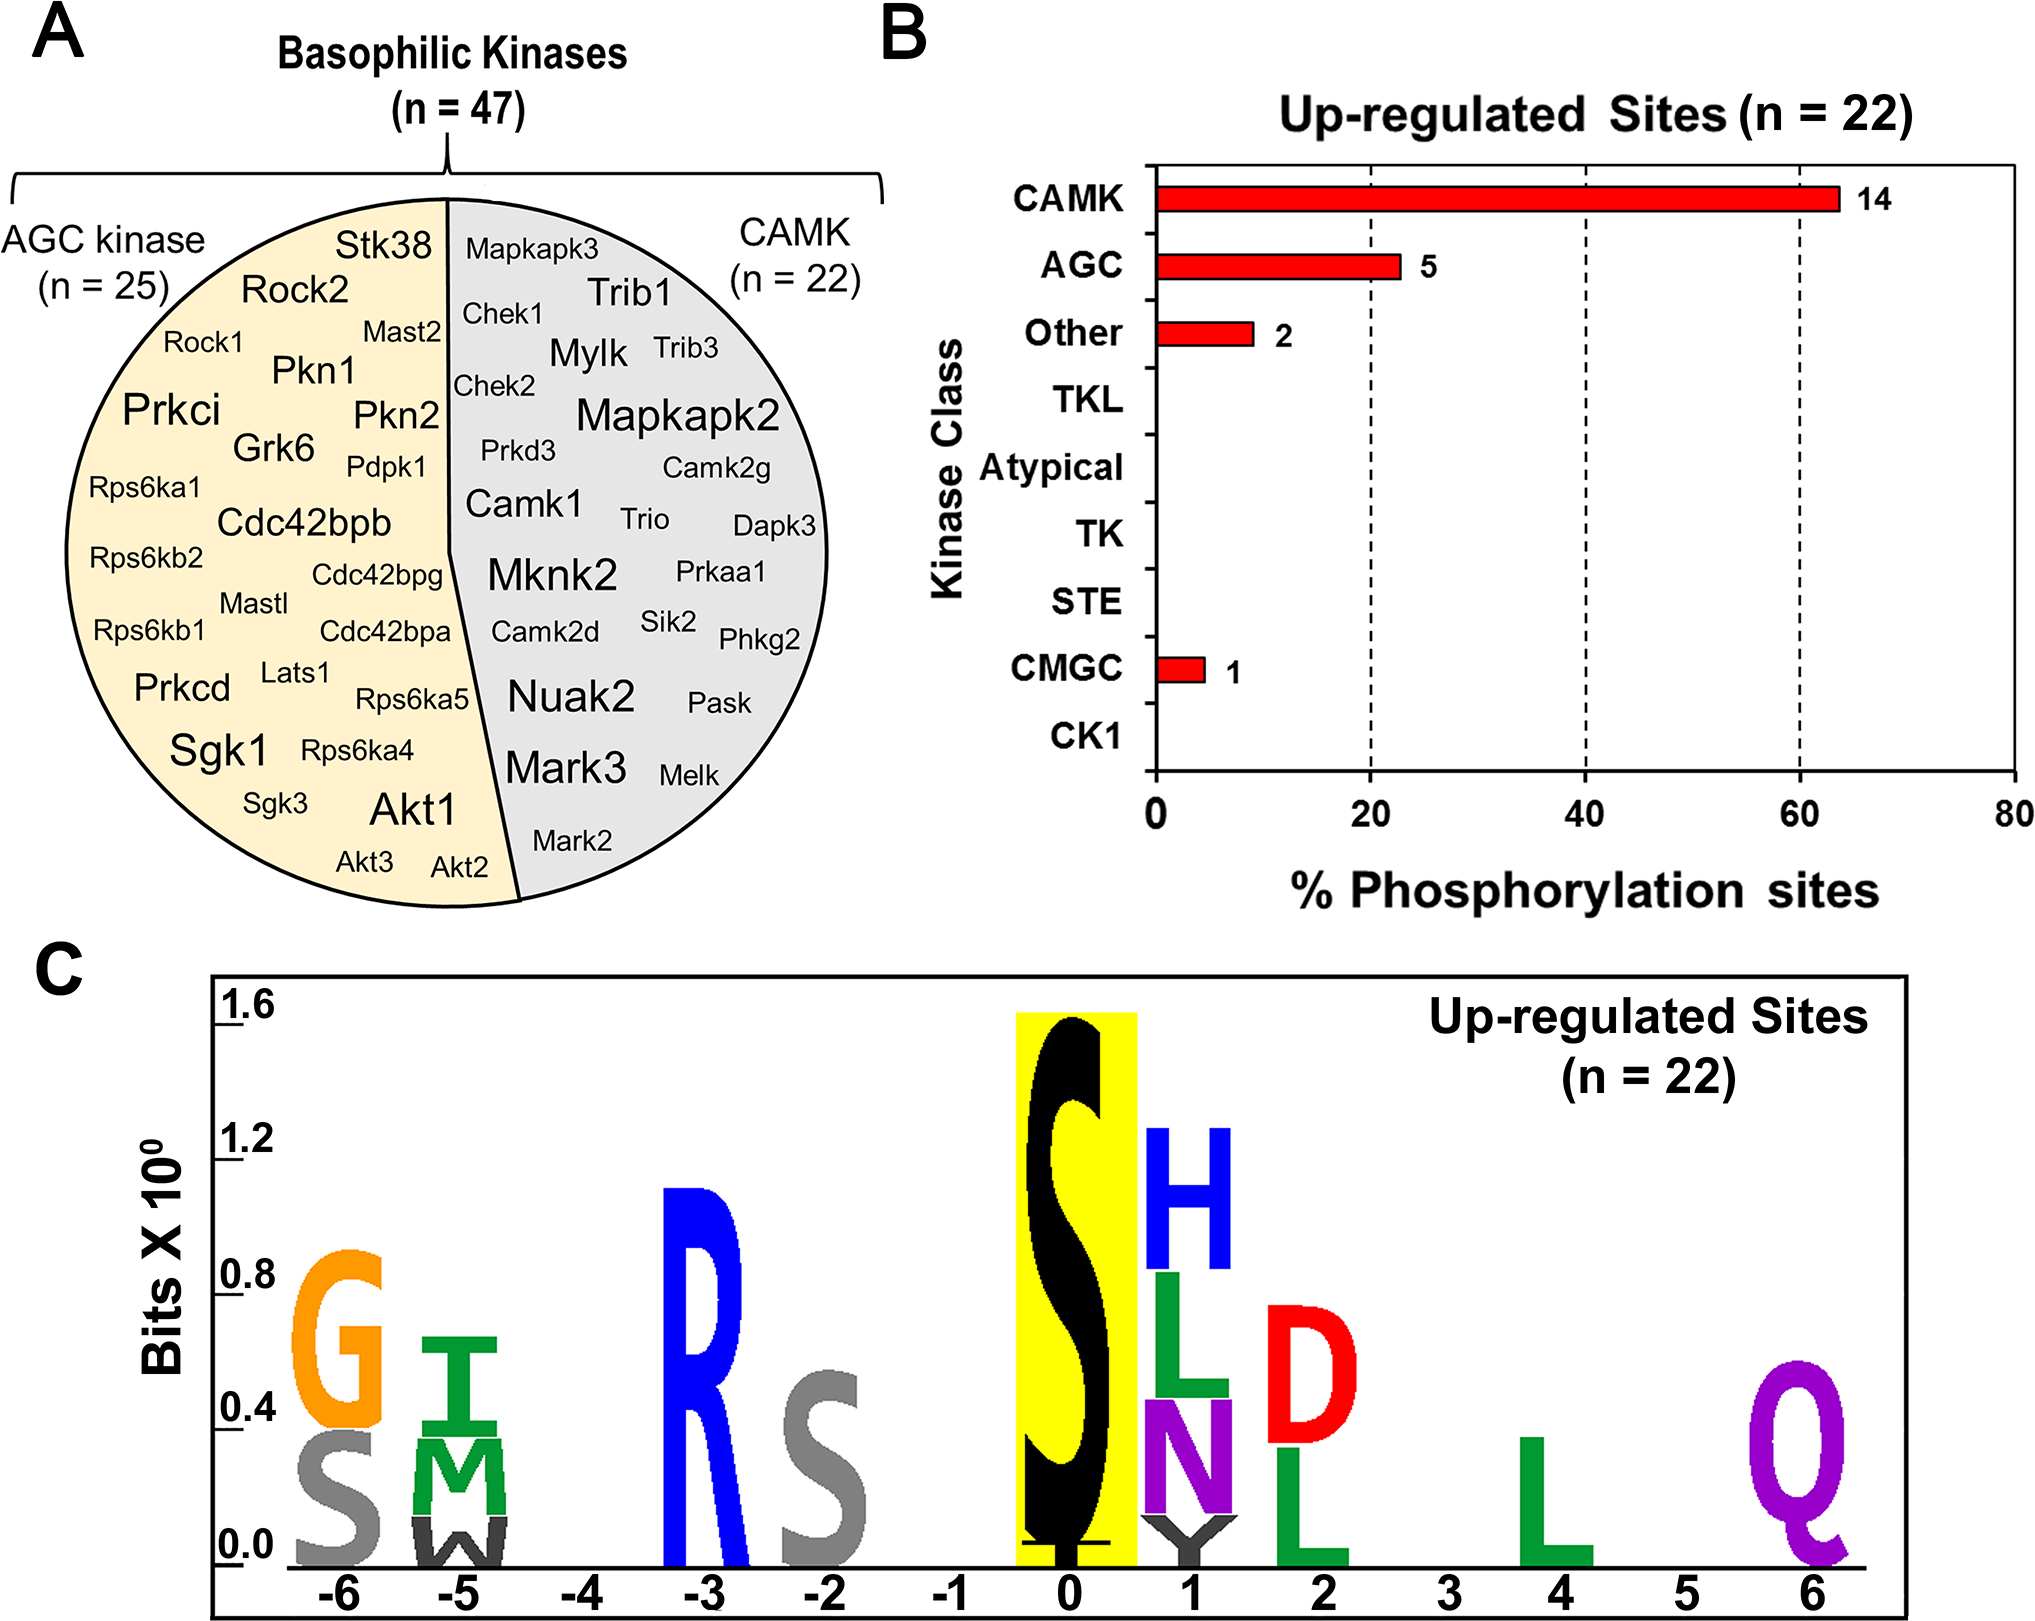
Figure 5.

(A) The circle contains gene symbols of 47 basophilic kinases expressed in PKA-null cells. The font-size corresponds to their expression at the RNA level as determined earlier by Isobe et al. (9). (B) Histogram to predict relative frequency of various kinase classes upstream of altered phospho-sites in dDAVP treated PKA-null cells. A total of 22 elevated phospho-sites were analyzed using GPS 3.0 to predict the class of individual kinases. A frequency distribution analysis was performed to determine the % of phospho-sites (x-axis) that belong to certain class of kinase (y-axis). CAMK (14/22, 63%) were the most frequently predicted kinase class among upregulated sites in PKA-null cells. (C) Sequence logo for the up-regulated phosphorylation sites in dDAVP treated PKA-null cells. PTM-Logo was used for motif analysis. The background contains all unique and mono-phosphorylated peptides.
