Figure 1.

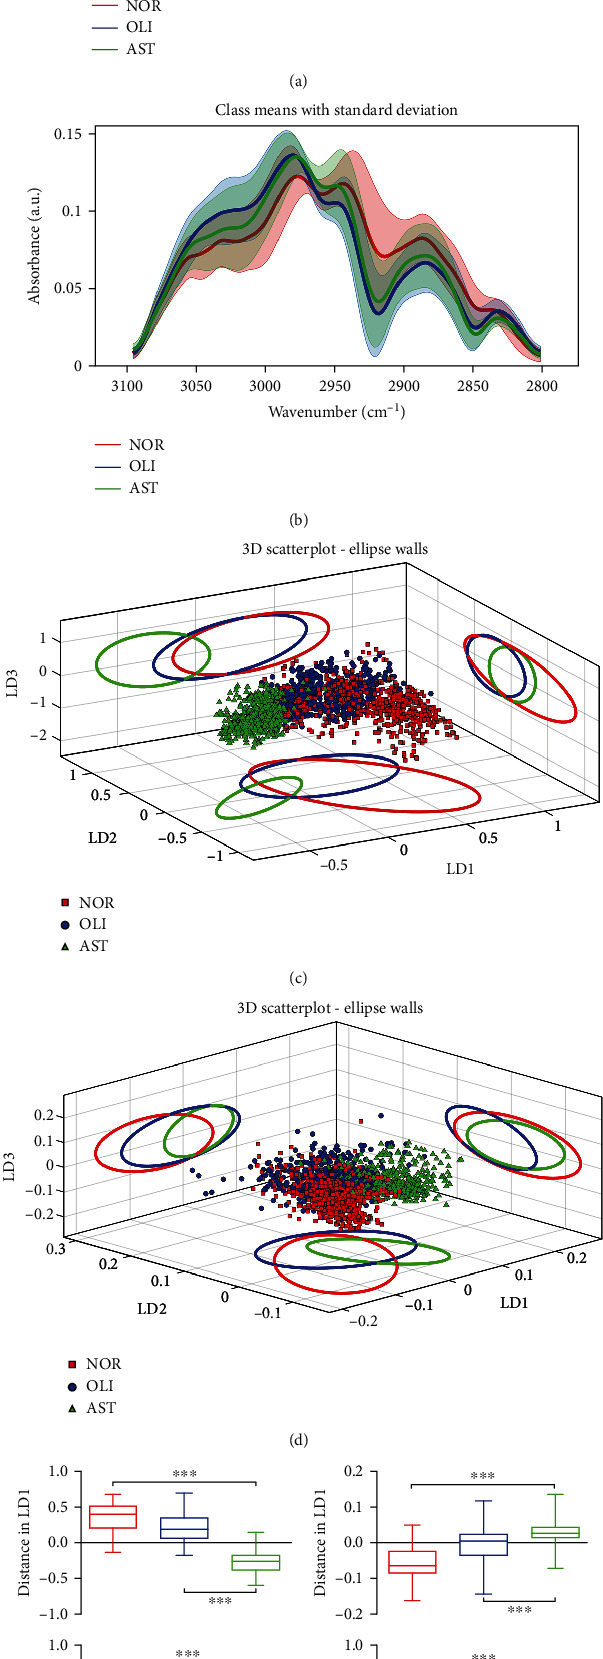
ATR-FTIR spectral classification of AST vs. NOR/OLI for seminal plasma samples. Mean preprocessed spectra with the standard deviation for all groups analyzed in the regions of 1800–900 cm−1 (a) and 3100–2800 cm−1 (b). Three-dimensional (3-D) PCA-LDA scores plots for the spectral regions of 1800–900 cm−1 (c) and 3100–2800 cm−1 (d). The different categories were classified as NOR (red solid line), OLI (blue solid line), and AST (green solid line). PCA-LDA scores regarding LD1 and LD2 in the regions of 1800–900 cm−1 (e) and 3100–2800 cm−1 (f). NOR: normozoospermia; OLI: idiopathic oligozoospermia; AST: idiopathic asthenozoospermia. LD1: linear discriminant 1; LD2: linear discriminant 2; LD3: linear discriminant 3. ∗∗∗P < 0.001vs. NOR/OLI.
