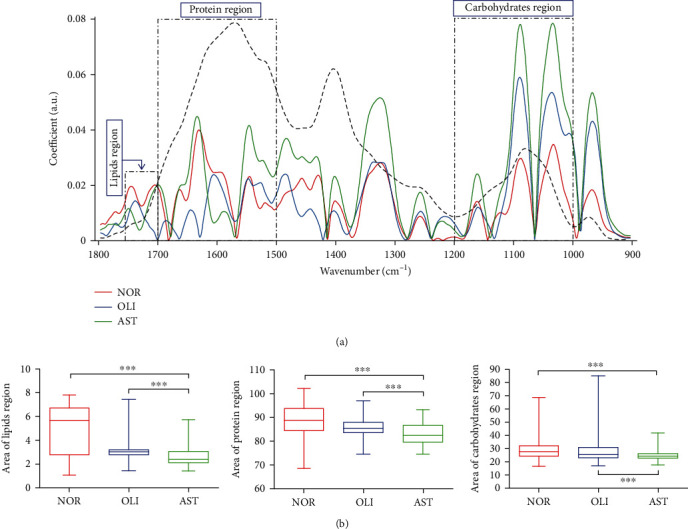
Figure 3.

Analysis of the lipid (1750–1700 cm−1), protein (1700–1590 cm−1), and carbohydrate (1200–1000 cm−1) regions. Additive spectral models, showing preprocessed (baseline corrected and normalized to amide I) expected and observed spectra in the biofingerprint region (1800–900 cm−1) (a). Comparisons of the lipid, protein, and carbohydrate regions between AST and NOR/OLI (b). NOR: normozoospermia; OLI: idiopathic oligozoospermia; AST: idiopathic asthenozoospermia. ∗∗∗P < 0.001vs. NOR/OLI.
