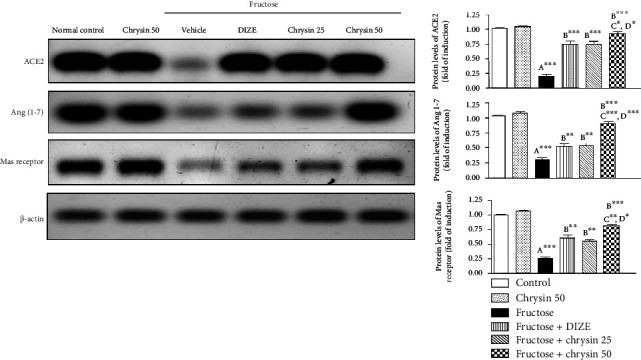
Figure 9.

Representative immunoblots and quantitative analysis of the protein levels of ACE2, Ang 1-7, and Mas receptor in liver tissues of the controls, NAFLD, DIZE, and chrysin-treated groups. ∗P < 0.05, ∗∗P < 0.01, and ∗∗∗P < 0.001. (A) Significantly different from the normal control group. (B) Significantly different from fructose-induced NAFLD. (C) Significantly different from fructose+chrysin 25. (D) Significantly different from fructose+DIZE.
