Figure 3.

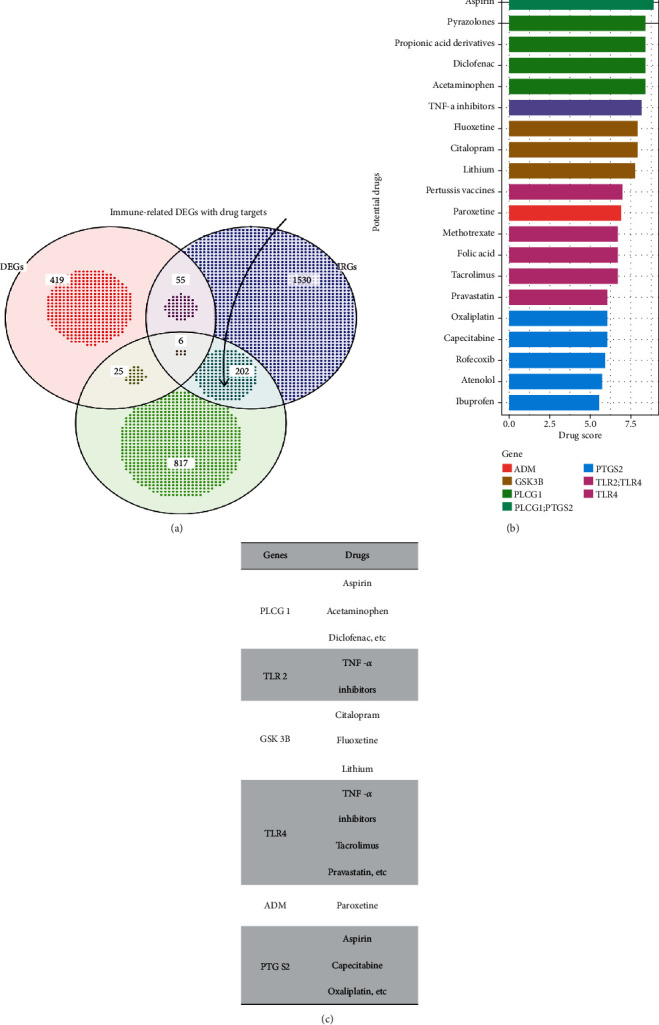
(a) Venn diagram shows the target genes of potential drugs obtained by the their gene sets. (b) and (c) Barplot and table show potential drugs and their targeted genes.

(a) Venn diagram shows the target genes of potential drugs obtained by the their gene sets. (b) and (c) Barplot and table show potential drugs and their targeted genes.