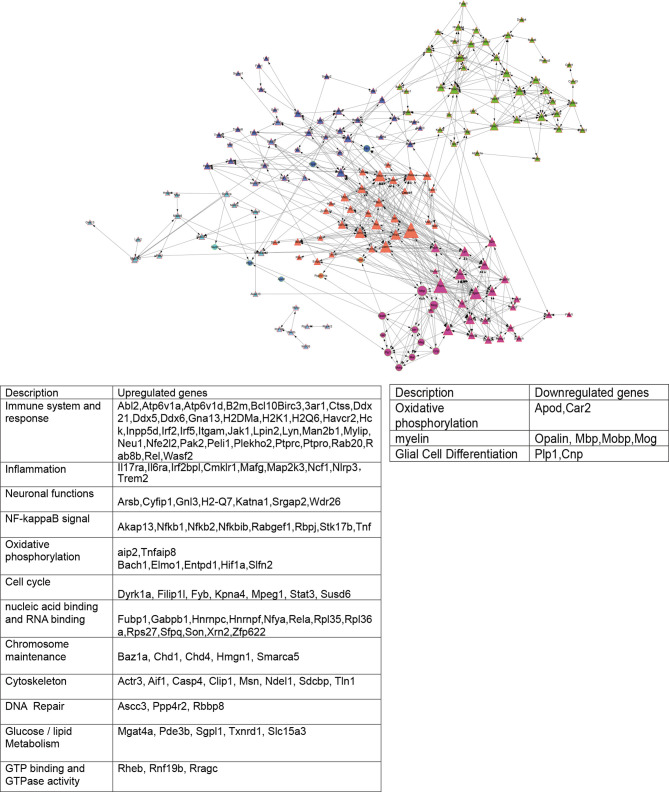
Figure 3.
STRING analysis of DEGs networks in db/db with db/m microglia. Shapes represent up - and downregulated messages. Triangles represent upregulated gene networks and circles represent downregulated gene networks; Different colors represent different cluster, the size of the dots represents the degree.

