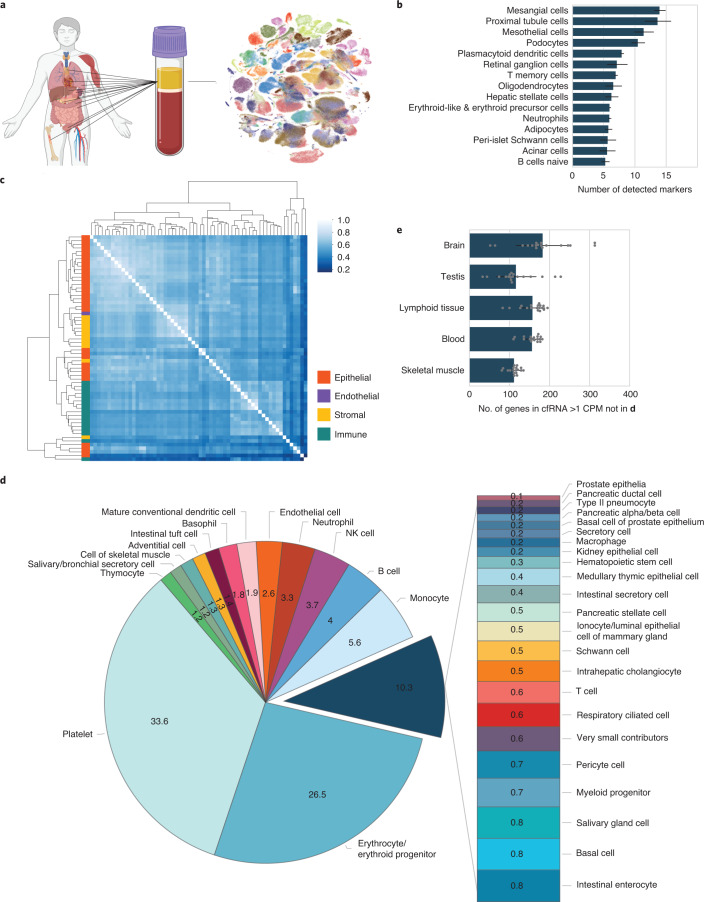
Fig. 1. Cell type decomposition of the plasma cell-free transcriptome using Tabula Sapiens.
a, Integration of tissue of origin and single-cell transcriptomics to identify cell types of origin in cfRNA. b, Cell-type-specific markers defined in context of the human body identified in plasma cfRNA. Error bars denote the s.d. of number of cell-type-specific markers (n = 75 patients); the measure of center is the mean. CPM-TMM counts for a given gene across technical replicates were averaged before intersection. c, Cluster heat map of Spearman correlations of the cell type basis matrix column space derived from Tabula Sapiens. Color bar denotes correlation value. d, Mean fractional contributions of cell-type-specific RNA in the plasma cell-free transcriptome (n = 18 patients). e, Top tissues in cfRNA not captured by basis matrix (the set difference of all genes detected in a given cfRNA sample and the row space of the basis matrix intersection with HPA tissue-specific genes). Error bars denote the s.d. of number of HPA tissue-specific genes with NX counts >10 and cell-free CPM expression ≥ 1 (n = 18 patients); the measure of center is the mean.

