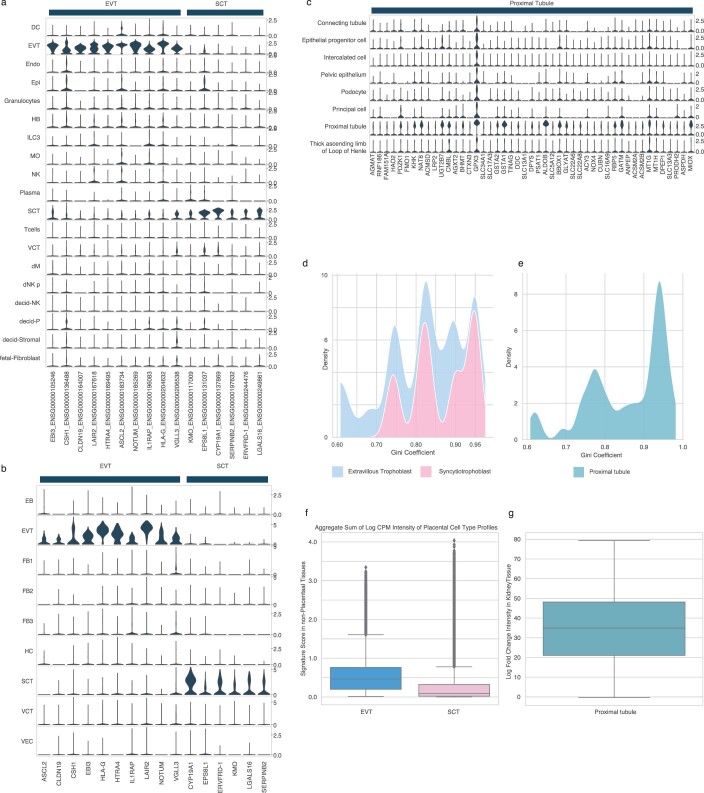
Extended Data Fig. 8. Comprehensive placental and renal cell type gene profile specificity at single cell and whole body resolution.
For box plots in f, g: horizontal line, median; lower hinge, 25th percentile; upper hinge, 75th percentile; whiskers span the 1.5 interquartile range; points outside whiskers indicate outliers. (a) Violin plot of derived syncytiotrophoblast and extravillous trophoblast gene profiles from Vento-Tormo et al. (b) Violin plot of derived syncytiotrophoblast and extravillous trophoblast gene profiles from Suryawanshi et al. (c) Violin plot of derived proximal tubule gene profile (d) Gini coefficient distribution for placental trophoblast cell types in (a) and (b) (e) Gini coefficient distribution for renal cell type in (c) (f) Distribution of placental trophoblast signature scores across all GTEx tissues. Note: given that the placenta is not in GTEx, the box plots correspond to the distribution of signature scores across non-placental tissues (sum of log-transformed counts-per-ten thousand) (n = 17382 non-placenta GTEx samples) (g) Log-fold change of renal cell type signature score in GTEx Kidney Cortex/Medulla samples relative to the mean non-kidney signature score, demonstrating that the predominant expression of the cell type signature in its native tissue is highest relative to other non-native tissues. Values are the log ratio of the signature score in the kidney to the mean signature score in the remaining non-kidney GTEx tissue samples (n = 89 GTEx renal cortex or medulla samples).

