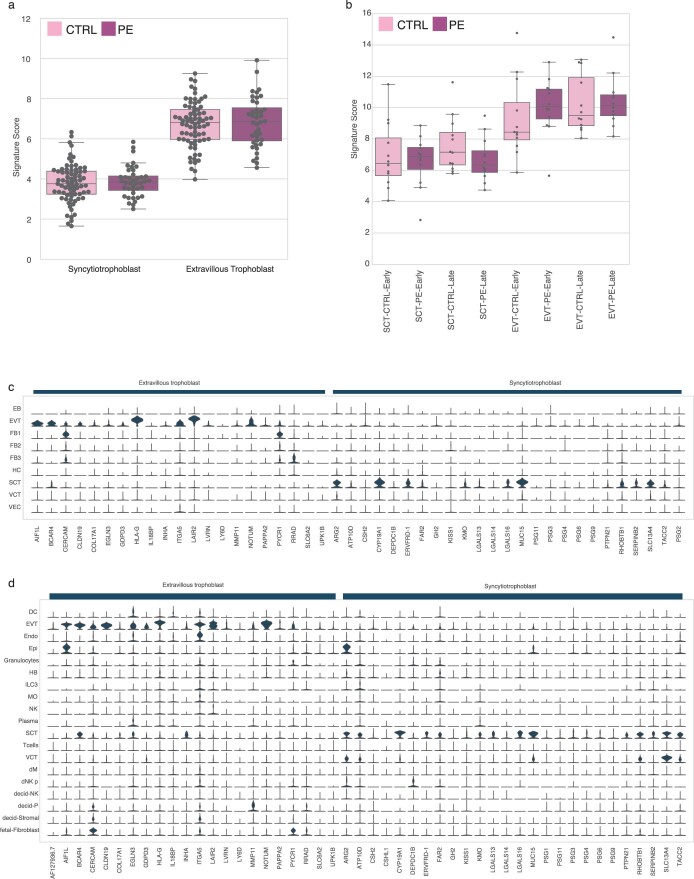
Extended Data Fig. 9. Expression distribution of Tsang et al trophoblast gene profiles in placenta scRNA atlases and in preeclampsia cfRNA.
Derived trophoblast signature scores in the (a) iPEC dataset (mothers with no complications, n = 73 patients; mothers with preeclampsia, n = 40 patients) and (b) PEARL-PEC (n = 12 patients for each early/late-onset PE cohorts and gestationally- age matched healthy controls) datasets from Munchel et al. Box plot: horizontal line, median; lower hinge, 25th percentile; upper hinge, 75th percentile; whiskers span the 1.5 interquartile range; points outside the whiskers indicate outliers. Stacked violin plot of the genes comprising the extravillous trophoblast and syncytiotrophoblast gene profiles from Tsang et al. intersecting with the measured genes in (c) Suryawanshi et al and (d) Vento-Tormo et al, reflecting the expression distribution across all observed placental cell types.

