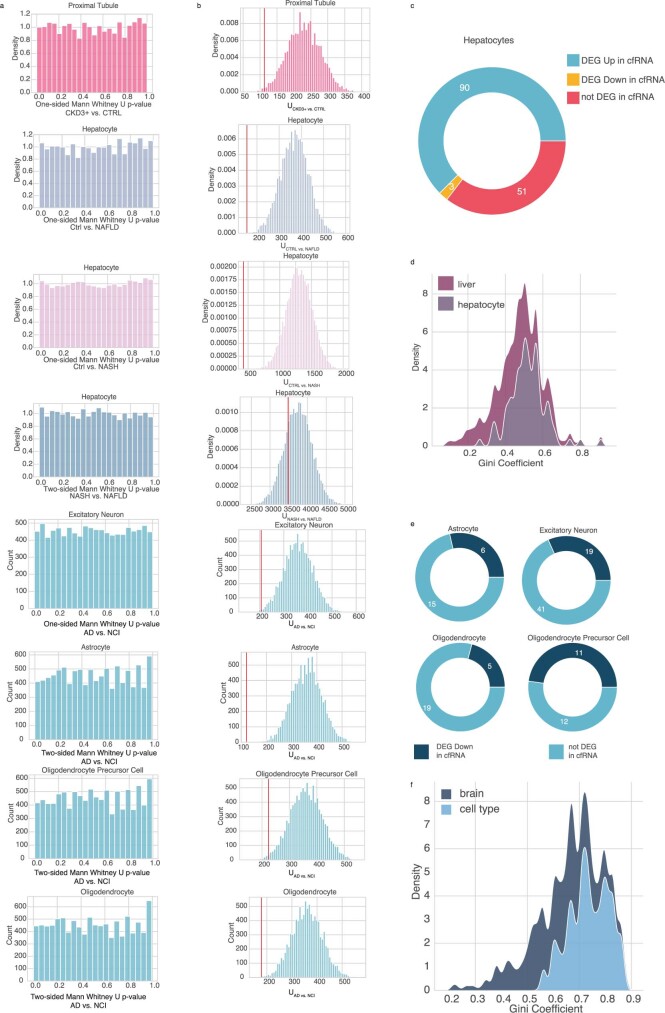
Extended Data Fig. 10. Assessment of cell type gene profile discriminatory power during signature scoring.
(a) Density of p-values over 10,000 trial permutation test to assess p-value calibration for a given signature score. In all cases, the distribution is uniform, as expected under the null. (b) Density of U values over 10,000 trial permutation test; red line indicates the U value corresponding to the experimental comparison reported in Fig. 2. (c) Donut plot reflecting the number of genes in the hepatocyte cell type gene profile that intersect with the reported NAFLD DEG in Chalasani et al. (d) Density plot reflecting the Gini coefficient distribution corresponding to DEG in NAFLD that are liver or hepatocyte specific. The Gini coefficient is computed using the mean expression per liver cell type in Aizarani et al (Methods). Area under each curve sums to one. (e) Donut plots reflecting the number of genes in brain cell type gene profiles that intersect with the reported AD DEG in Toden et al. (f) Density plot reflecting the Gini coefficient distribution corresponding to DEG in AD that are brain or brain cell type specific. The Gini coefficient is computed using the mean expression per brain cell type in the ‘Normal’ samples of Mathys et al (Methods). Area under each curve sums to one.

