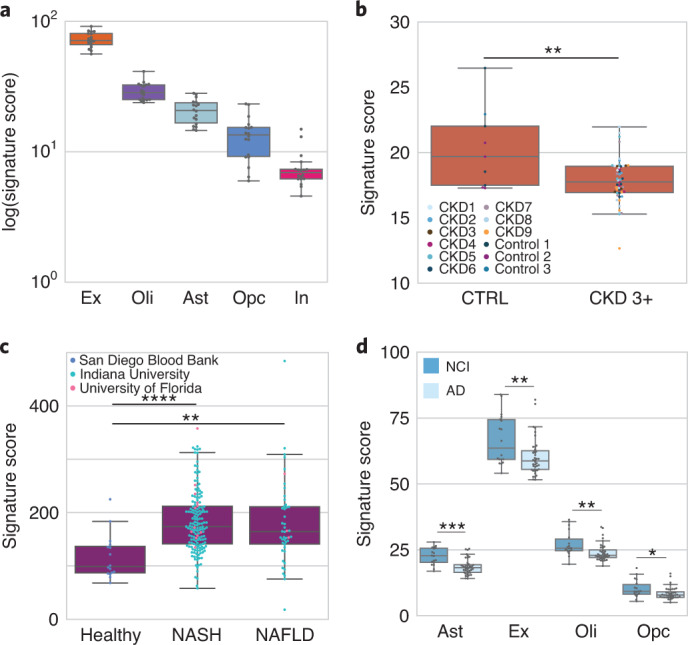
Fig. 2. Cellular pathophysiology is non-invasively resolvable in cfRNA.

For a given box plot, any cell type signature score is the sum of log-transformed CPM-TMM normalized counts. The horizontal line denotes the median; the lower hinge indicates the 25th percentile; the upper hinge indicates the 75th percentile; whiskers indicate the 1.5 interquartile range; and points outside the whiskers indicate outliers. All P values were determined by a Mann–Whitney U-test; sidedness is specified in the subplot caption. *P < 0.05, **P < 10−2, ***P < 10−4, ****P < 10−5. a, Neuronal and glial cell type signature scores in healthy cfRNA plasma (n = 18) on a logarithmic scale. b, Comparison of the proximal tubule signature score in CKD stages 3+ (n = 51 samples; nine patients) and healthy controls (n = 9 samples; three patients) (P = 9.66 × 10⁻³, U = 116, one sided). Dot color denotes each patient. c, Hepatocyte signature score between healthy (n = 16) and both NAFLD (n = 46) (P = 3.15 × 10⁻⁴, U = 155, one sided) and NASH (n = 163) (P = 4.68 × 10⁻⁶, U = 427, one sided); NASH versus NAFLD (P = 0.464, U = 3483, two sided). Color reflects sample collection center. d, Neuronal and glial signature scores in AD (n = 40) and NCI (n = 18) cohorts. Excitatory neuron (P = 4.94 × 10⁻³, U = 206, one sided), oligodendrocyte (P = 2.28 × 10⁻³, U = 178, two sided), oligodendrocyte progenitor (P = 2.27 × 10⁻², U = 224, two sided) and astrocyte (P = 6.11 × 10⁻⁵, U = 121, two sided). Ast, astrocyte; Ex, excitatory neuron; In, inhibitory neuron; Oli, oligodendrocyte; Opc, oligodendrocyte precursor cell.
