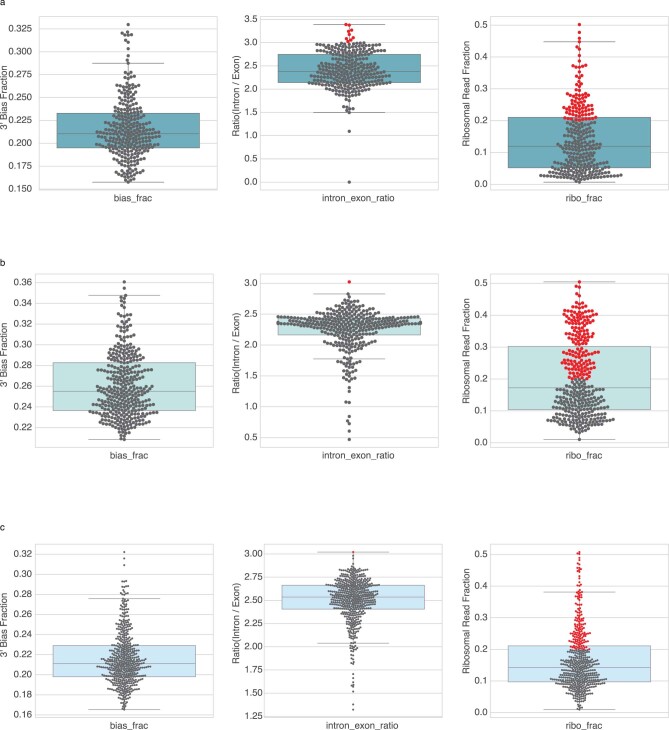
Extended Data Fig. 1. Cell-free RNA Sample Quality Control.
Quality control metrics (3′ bias fraction, ribosomal fraction, and DNA contamination) were determined for each cfRNA sample downloaded from a given SRA accession number. Samples with outlier values are highlighted in red and were not considered in subsequent analyses (see Methods section ‘Sample quality filtering’). (a) Ibarra et al (n = 285) (b) Toden et al (n = 339) (c) Chalasani et al (n = 500). Box plot: horizonal line, median; lower hinge, 25th percentile; upper hinge, 75th percentile; whiskers span the 1.5 interquartile range; points outside the whiskers indicate outliers. Each point corresponds to a downloaded cfRNA sample from the corresponding SRA accession number.

