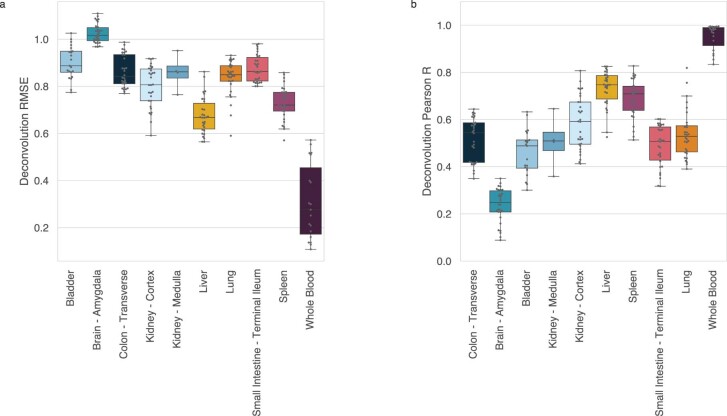
Extended Data Fig. 3. Tabula Sapiens basis matrix performance on GTEx bulk RNA samples using nu-SVR.
GTEx tissue samples possessing cell types wholly present and absent from the basis matrix column space were selected. For box plots: horizonal line, median; lower hinge, 25th percentile; upper hinge, 75th percentile; whiskers, 1.5 interquartile range; points outside the whiskers indicate outliers. There are 30 bulk RNA seq samples for a given tissue except for the Bladder (n = 21), Kidney – Medulla (n = 4), and Whole Blood (n = 19). (a) Root mean square error between predicted expression and measured expression in a given GTEx tissue. Units are zero-mean unit variance scaled CPM counts. Tissues present in TSP have reduced RMSE compared to those that are absent (Kidney – Medulla and Brain). Tissues with high cellular heterogeneity (for example Lung, Bladder, Small Intestine, Kidney) exhibit reduced deconvolution performance compared to less heterogeneous tissues (for example Whole Blood, Spleen, Liver). (b) Pearson correlation between predicted expression and measured expression in a given GTEx tissue.

