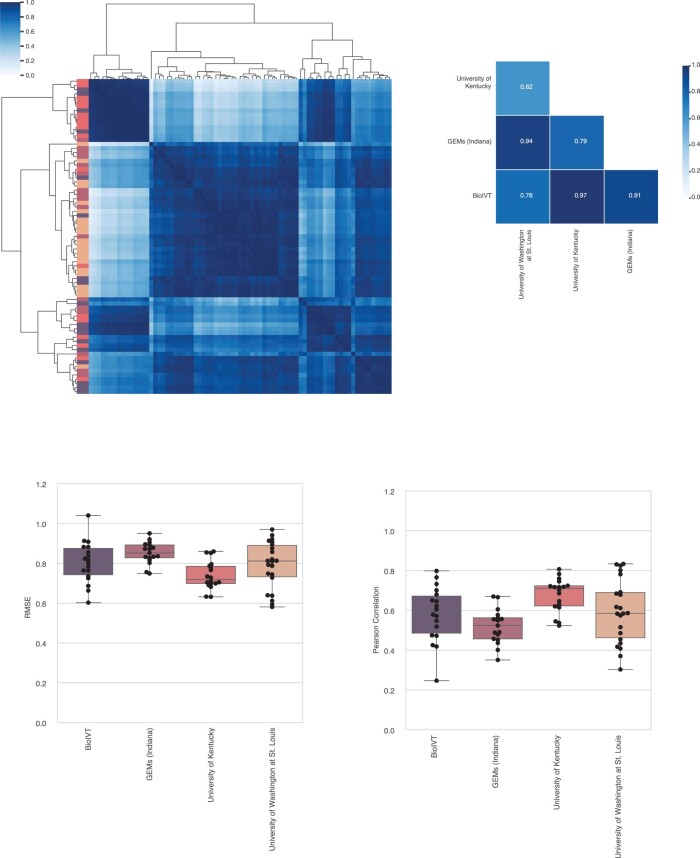
Extended Data Fig. 5. nuSVR decomposition of the plasma cell free transcriptome with Tabula Sapiens.
For boxplots, horizonal line, median; lower hinge, 25th percentile; upper hinge, 75th percentile; whiskers span the 1.5 interquartile range; points outside the whiskers indicate outliers. Each point corresponds to a patient in a given cohort; University of Indiana (n = 17), University of Kentucky (n = 18), Washington University in St. Louis (n = 22), and BioIVT (n = 18). For heatmaps or clustermaps, the scale bar denotes the pearson correlation value. (a) Complete linkage clustermap of pairwise pearson correlation of deconvolved cell type fractions between patients from a given center; row color denotes a given center (n = 75 patients). (b) Heatmap of pairwise pearson correlation of the mean cell type coefficients per center. (c) Deconvolution RMSE between predicted vs. measured expression for all biological replicates across all centers. (d) Deconvolution pearson correlation between predicted vs. measured expression for all biological replicates across all centers.

