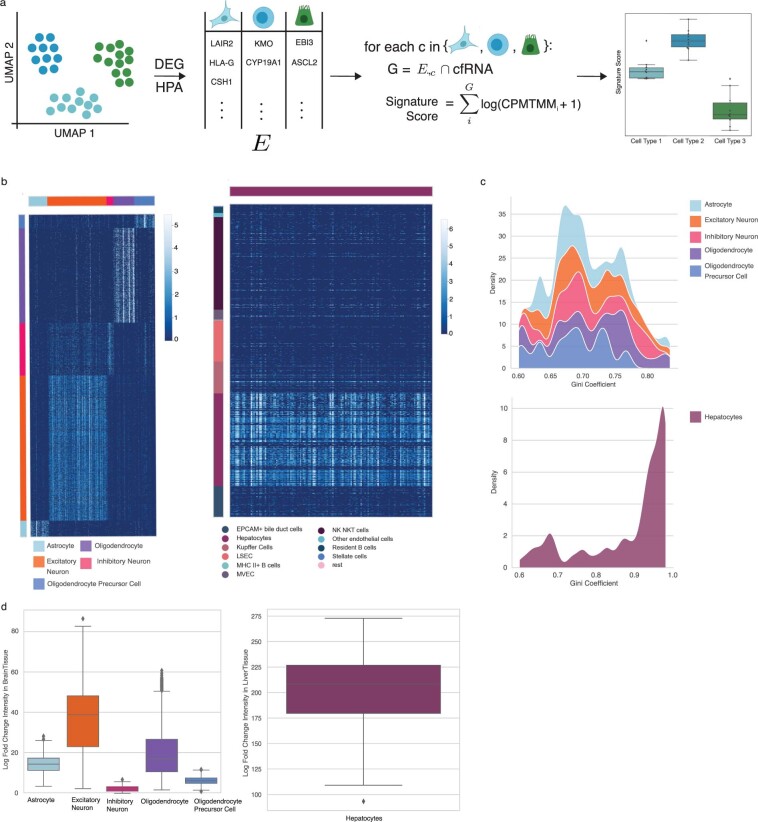
Extended Data Fig. 6. Establishing gene profile cell type specificity in context of the whole body using single cell and bulk RNA-seq data.
(a) Cell type signature scoring procedure; please see the ‘Signature Scoring’ in the Methods for the full derivation procedure of a given cell type gene profile. (b) Single cell heatmaps for gene cell type profiles within the corresponding tissue cell atlas, demonstrating that a cell type specific profile is unique to a given cell type across those within a given tissue. Columns denote marker genes for a given cell type; rows indicate individual cells. The color bar scale corresponds to log-transformed counts-per-ten thousand. (c) Gini coefficient density plot for genes in cell type profiles derived from brain and liver single cell atlases using HPA NX counts. The area under the curve for a given cell type sums to one. (d) Log fold change in bulk RNA-seq data of a given cell type profile, demonstrating that the predominant expression of the cell type signature in its native tissue is highest relative to other non-native tissues. Values are the log-fold change of the signature score of a given cell type profile in the native tissue (indicated by the y-axis) to the mean expression in the remaining non-native tissues. Box plot: horizontal line, median; lower hinge, 25th percentile; upper hinge, 75th percentile; whiskers span the 1.5 interquartile range; points outside the whiskers indicate outliers (n = 2462 GTEx brain samples for box plot on left; n = 226 GTEx liver samples, right).

