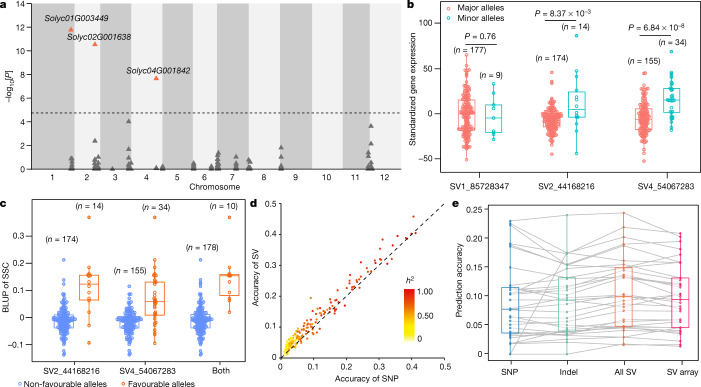
Fig. 4. The graph pangenome empowers MAS and genomic selection.
a, Association study of SSC for the cis-SV set using LASSO. Genes with significant associated SVs are indicated (orange triangles). b, SVs affecting the expression of their nearby genes. P values were derived from two-sided Wilcoxon rank sum tests. c, Selection of accessions with high SSC using SVs. For b and c, n represents the sample size in each group. d, Comparison of genomic selection accuracies using SNPs and SVs as markers. The colour scale indicates the estimated heritability contributed by SNPs. e, Comparison of genomic selection accuracies using different types of genetic variants. n = 33 metabolic traits are plotted. ‘SV array’ denotes the SV panel for the DNA capture array. For b, c and e, the box and whisker plots show the median (centre line), mean (cross), upper and lower quartiles (box limits), 1.5× the interquartile range (whiskers) and outliers (solid points). Individual data points are plotted in circles.

