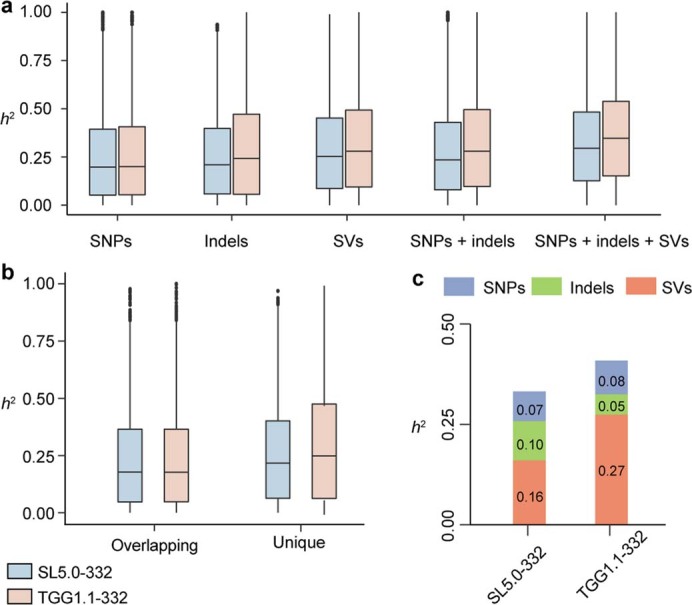
Extended Data Fig. 4. Evaluation of contributions to heritability by different variant types.

a) Comparison of heritability estimated from different combinations of genetic variants from SL5.0-332 and TGG1.1-332. b) Comparison of estimated heritability based on SNPs of different groups. n = 6,375 independent traits (a, b) were evaluated. ‘Overlapping’ refers to SNPs found in both TGG1.1-332 and SL5.0-332. ‘Unique’ refers to SNPs uniquely identified in either TGG1.1-332 or SL5.0-332. Box and whisker plots (a, b) with centre line = median, cross = mean, box limits = upper and lower quartiles, whiskers = 1.5 × interquartile range and solid points = outliers. c) Heritability contributed by different variant categories using a composite model.
