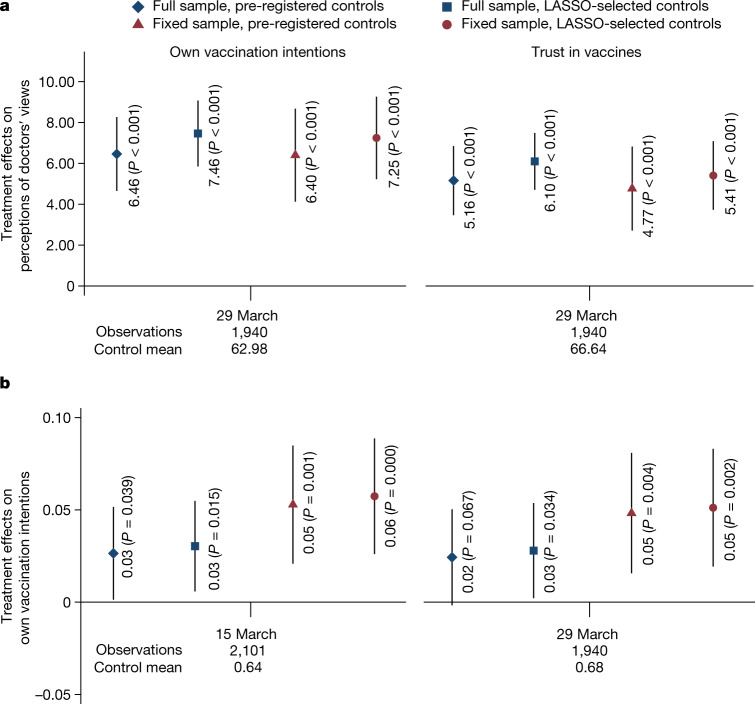
Fig. 3. Effects of the Consensus condition on posterior beliefs about doctors’ views and vaccination intentions.
A sample of the adult Czech population. a, Estimated effects of the Consensus condition on beliefs about the percentage of medical doctors who plan to get vaccinated (left panel) and on beliefs about the percentage of doctors who trust approved COVID-19 vaccines (right panel), measured in wave 1 (29 March; Consensus condition n = 970; Control n = 970). b, The dependent variable is an indicator for an intention to be vaccinated with a vaccine against COVID-19, measured in wave 0 (15 March; Consensus condition n = 1,050; Control n = 1,051) and wave 1 (29 March; Consensus condition n = 970; Control n = 970). We report the results of two specifications: (1) a linear probability regression controlling for pre-registered covariates: gender, age category (6 categories), household size, number of children, region (14 regions), town size (7 categories), education (4 categories), economic status (7 categories), household income (11 categories) and baseline vaccination intentions, and (2) a double-selection LASSO linear regression selecting from a wider set of controls in Extended Data Table 1, including prior vaccine uptake and beliefs about the views of doctors. Markers show the estimated effects and the whiskers denote the 95% confidence interval based on Huber–White robust standard errors. The estimated effects and Student's t-test (two-sided) P values are reported in the figure. No adjustments were made for multiple comparisons. We report estimates for (1) all observations, full sample (diamond and square), and (2) for a sub-sample of participants who took part in all 12 waves (Consensus condition n = 614; Control n = 598), fixed sample (triangle and circle). In the lower part of the figure, we report the timing, the total number of observations and the Control mean for each wave. See Supplementary Section 3.5 for further specification details. Supplementary Tables 5 and 6 show the regression results for a and b in detail, respectively.

