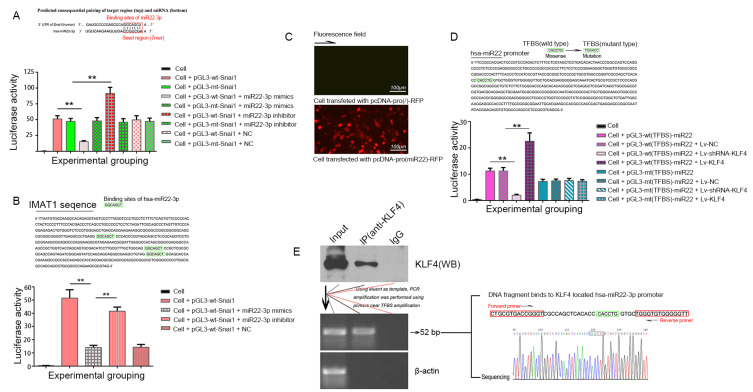
Fig. 3. Luciferase assay and ChIP-PCR.
(A) Hsa-miR22-3p binds to Snai1 3’-UTR. Upper, predicted binding site of hsa-miR22-3p in 3’-UTR of Snai1. Down, the histogram shows the relative firefly luciferase activity in the different experimental groups. **P < 0.01, compared to the group transfected with the same vector but without the hsa-miR22-3p mimics or inhibitor. Data are expressed as mean ± SD of at least three independent experiments. (B) Hsa-miR22-3p binds to Snai1 3’-UTR, which is inhibited by IMAT1. Upper, predicted binding site of hsa-miR22-3p in IMAT1. Down, expression of a luciferase cassette encoding the IMAT1. **P < 0.01, compared with the group transfected with pGL3-wt-Snai1 and hsa-miR22-3p mimics. Data are expressed as mean ± SD of at least three independent experiments. (C) Fluorescence microscopic images showing the expression of RFP in 293T cells 48 h after transfection with plasmids carrying hsa-miR22-3p promoter upstream of RFP gene. (D) Verification of the TFBS of KLF4 in the hsa-miR22-3p promoter by luciferase assay. Renilla luciferase was used as reference. **P < 0.01. The tests were carried out on three biological triplicates, and data are expressed as the mean ± SD. (E) ChIP-PCR assay. Immunoprecipitation of KLF4 (left), PCR amplification of the predicted KLF4 binding sequence in the hsa-miR22-3p promoter, and sequencing of the PCR product for the predicted site (right). Cell is 293T cell.

