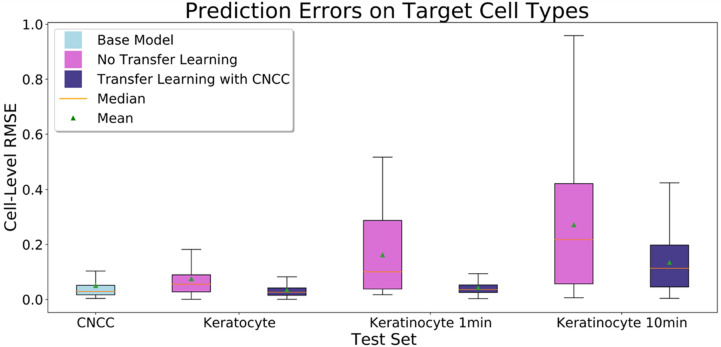
Figure 6.
Distributions of RMSE values for the base model on the CNCC test set (benchmark), the keratocyte model on the keratocyte test set, and the transfer learning model on the keratocyte test set. Distributions of RMSE values for the base model on the CNCC test set (benchmark), the target cell models without transfer learning on the target cell test sets, and the target cell models which used transfer learning with the CNCC source domain on the target cell test sets. The boxes represent the middle 50% of error values and the whiskers extend to the minimum and maximum error values.

