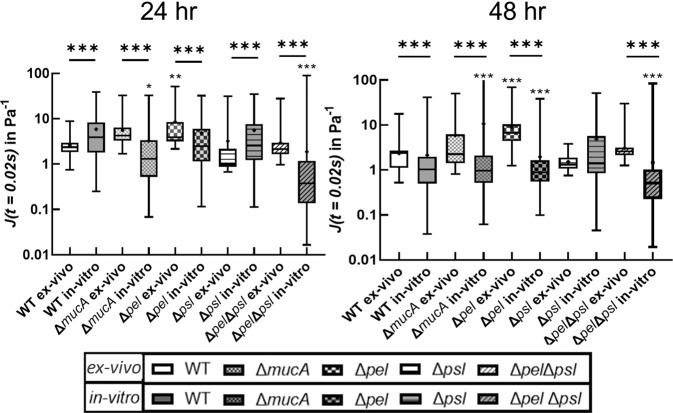
Fig. 3. Box whisker plot at semi-log scale showing the creep compliance measured using individual tracked particles.
A box represents the middle 50% range of data, lines within boxes are the median of the distribution, the black dot represents the mean, and the upper/lower vertical line represents the upper/lower quartiles. Star values directly over each strain indicate comparison to the respective WT PAO1 (ex vivo for ex vivo, and in vitro for in vitro) done using a non-parametric Kruskal–Wallis one-way ANOVA method with Dunn’s multiple comparisons among tested groups. Stars values over horizontal lines compare a strain’s ex vivo and in vitro measurements done using a Mann–Whitney test. P ≤ 0.05 demarcated with *, P ≤ 0.01 demarcated with **, and P ≤ 0.001 demarcated with ***. P ≤ 0.05 demarcated with *, P ≤ 0.01 demarcated with **, and P ≤ 0.001 demarcated with ***. In vitro data reproduced from ref. 25 with permission from the Royal Society of Chemistry.

