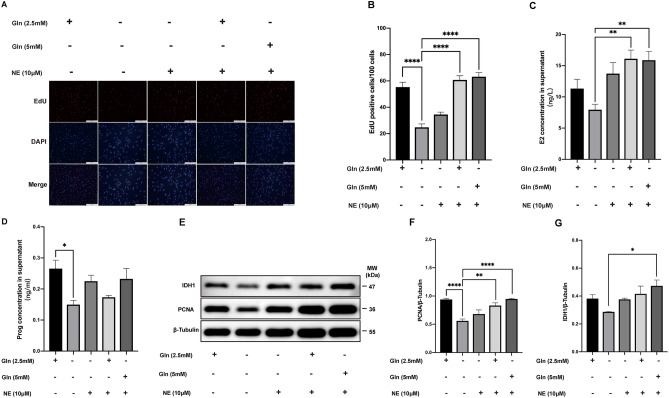
Figure 6.
Effect of glutamine (Gln) and norepinephrine (NE) on the function of granulosa cells in vitro (A) Immunofluorescent staining of EdU and DAPI in KGN cells for proliferation analysis. (B) The column chart shows EdU-positive cells per 100 cells in different treatment groups. (C,D) Column displays the concentrations of E2 and Prog in the conditioned medium from different treatments of KGN cells. (E–G) Evaluation of the expression of IDH1 and PCNA protein in different treatment groups by western blotting. All indicated P values were determined by one-way analysis of variance. *P value < 0.05; **P value < 0.01; ****P value < 0.0001.

