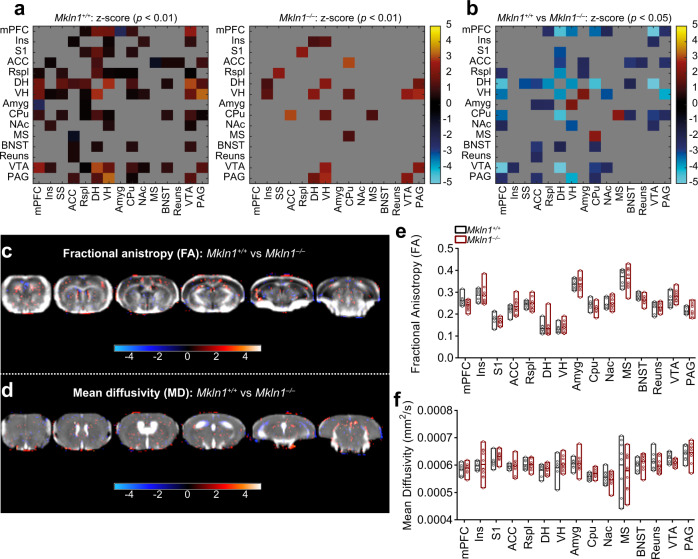
Fig. 4. Widespread alterations in resting-state functional connectivity but largely intact brain tissue microstructure in Mkln1-null mice.
a, b Resting-state functional connectivity (FC) analyses of BOLD signal synchronization of fifteen regions of interest (ROI). a Connectivity matrices of Mkln1+/+ mice (left panel) and Mkln1–/– mice (right panel), in which functional correlations (z-score) between pairs of regions are depicted by color scale. Compared with Mkln1+/+ control mice, Mkln1–/– mice displayed visibly weaker interregional FC. b Statistical analyses of FC strength are depicted as a matrix, revealing the direction of significant genotype differences for each ROI-ROI connection. Relative to Mkln1+/+ control mice, blue-to-light blue elements indicate regions of significantly reduced FC, while red elements depict regions exhibiting significantly increased FC in Mkln1–/– mice. c–f Diffusion tensor imaging (DTI) in Mkln1+/+ and Mkln1–/– mice. Diffusion parameters (fractional anisotropy (FA) and mean diffusivity (MD) were analyzed using an ROI-based approach. (c, d) Representative set of six axial FA and MD images. The FA (c) and MD (d) maps are overlaid with resulting significant t values (P < 0.05) following a voxel-wise t-test comparing the DTI data between the two genotype groups. Also shown are the z-score values in a color scale ranging from −4 to 4. e, f Bar graphs illustrate genotype-dependent comparisons of FA and MD values in the different ROIs. Values represent mean ± SEM. (Mkln1+/+ (N = 8); Mkln1–/– (N = 11). Brain region abbreviations are defined in Supplementary Fig. S2.

