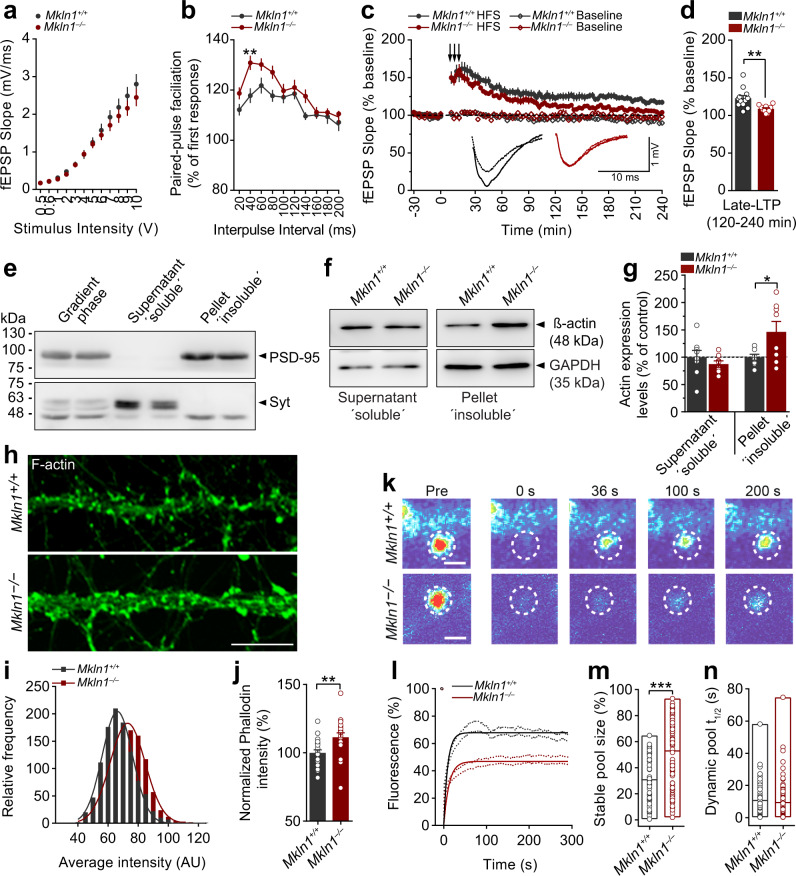
Fig. 6. Mkln1 deletion impairs long-term synaptic potentiation and leads to modifications in spine actin.
a, b Basal synaptic transmission in acute hippocampal slices. a Input–output (I/O) curves obtained by plotting the field excitatory postsynaptic potentiation (fEPSP) slope against stimulus intensity were comparable between Mkln1–/– and Mkln1+/+ slices. b The paired-pulse ratio was recorded across different interstimulus intervals (ISI). Note the significantly larger paired-pulse facilitation (PPF) in Mkln1–/– slices relative to Mkln1+/+ slices (genotype: F(1,31) = 12.31, P < 0.01). PPF was maximal at ISI = 40 ms in Mkln1–/– slices (**P < 0.01) and decreased with larger intervals. Mkln1+/+ (n = 17 slices); Mkln1–/– slices (n = 16 slices). c, d Mkln1–/– mice showed impaired late-LTP induced by high-frequency stimulation (HFS) trains in the Schaffer collateral-CA1 region (arrows: 3× 1 s stimulations of 100 Hz at 0, 6, and 12 min). c The averaged fEPSP-slope values normalized to 30-min baseline. Despite comparable initial induction of LTP in Mkln1–/– and Mkln1+/+ slices, the potentiation effect decayed more rapidly in Mkln1–/– slices (time × genotype: F(90,1800) = 1.48, P < 0.01), leading an overall significant reduction in LTP (genotype: F(1,20) = 6.33, P < 0.05) by the end of a 4 h recording. Diamond points illustrate baseline recording in the CA1 region. Inset: Representative fEPSP traces (Dashed lines correspond to baseline while solid lines represent LTP). d Averaged fEPSP-slope values from 120–240 min (Late-LTP), which are significantly decreased in Mkln1–/– slices (Independent t-test: t(20)= −3.18, P < 0.01). Data are represented as mean ± SEM. Mkln1+/+ (N = 7 mice); Mkln1–/– (N = 8 mice). Baseline: Mkln1+/+ (n = 12 slices), Mkln1–/– (n = 10 slices); HFS: Mkln1+/+ (n = 12 slices), Mkln1–/– (n = 10 slices). e Immunoblots of fractionated extracts from hippocampal tissue showing separation into soluble (supernatant) and insoluble (pellet) fractions. Enrichment of synaptotagmin (Syt) and PSD-95 is shown in the soluble and insoluble fractions, respectively. f, g Analysis of actin levels in Mkln1+/+ and Mkln1–/– hippocampal tissue lysates. f The upper panel shows representative blots of actin levels in the soluble and insoluble fractions. Protein levels were normalized to the housekeeping gene, Glyceraldehyde 3-phosphate dehydrogenase (GAPDH). g Compared with Mkln1+/+ tissue, actin protein levels were significantly increased in insoluble fractions of Mkln1–/– hippocampal tissue (independent t-test with Welch’s correction: t(8.13) = 2.34, P < 0.05). Mkln1+/+ (N = 8); Mkln1–/– (N = 8) from 3 independent preparations. Data are expressed as a percentage of control ± SEM. h Representative images of Mkln1+/+ and Mkln1–/– dissociated hippocampal neurons stained with phalloidin. Scale bar, 5 µm. i Frequency distribution showing F-actin immunoreactivity within phalloidin-stained regions of interest (ROI). The intensity of F-actin labeling in actin-rich compartments is significantly higher in Mkln1–/– neurons than Mkln1+/+ controls (two-sample KS test: D = 0.24, P < 0.0001, Mkln1+/+: 1054; Mkln1–/–: 1067 dendritic protrusions). j Normalized phalloidin intensity measures were significantly increased in Mkln1–/– actin-positive ROIs compared with Mkln1+/+ controls (independent t-test: t (38) = 2.88, P < 0.01). Mkln1+/+ (n = 20); Mkln1–/– (n = 20) neurons from two to three independent preparations. Data are expressed as a percentage of control ± SEM. k–n Elimination of muskelin leads to an increase in the spine F-actin stable pool. k FRAP analysis of GFP-actin 1 day after transfection of cultured hippocampal neurons (DIV 13); representative spine heads before and at different points after the laser bleaching impulse. Imaging and photobleaching conditions were similar for both conditions. Scale bar = 2 µm. l Analysis of GFP-actin fluorescence recovery shows that the plateau of the recovery curve in Mkln1–/– spines does not approach the same level as Mkln1+/+ spines. m The stable actin fraction measured from FRAP curves of individual spines is significantly increased in Mkln1–/– spines (genotype: β = 16.98, t = 5.49, P < 0.0001). n The GFP-actin recovery half-time of the dynamic F-actin pool is comparable for Mkln1–/– and Mkln1+/+ spines. Scatter plots depict results per spine, and the line within bar graphs corresponds to the group mean value. Mkln1+/+ (n = 17 neurons, 47 spines), Mkln1–/– (n = 25 neurons, 94 spines; 2 independent replications from four to six embryos per genotype.

