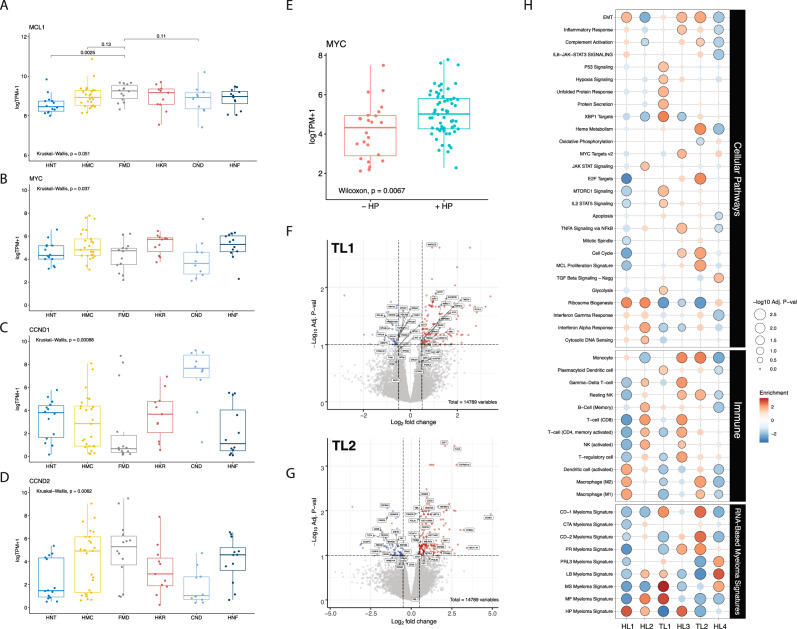
Fig. 2. Differential gene expression and gene set enrichment analysis for tumors from the six genetic subtypes (n = 89).
A–D Comparison of gene expression levels of MCL1, MYC, CCND1, and CCND2 among the six genetic subtypes. Two-sided p value derived from Kruskal–Wallis test. E Comparison of expression levels of MYC oncogene expression between the two non hyperdiploid ones (-HL) and the four hyperdiploid (+HL) subtypes. Two-sided p-value was calculated using the Wilcoxon rank-sum test. Expression is measured by the log2 value of transcript per million of each gene (log2 TPM + 1). Boxplots representing median, and interquartile range, whiskers representing first, and fourth quartile. F Volcano plot showing fold changes for genes differentially expressed between tumors of TL1 subtype and the other subtypes. G Volcano plot showing fold changes for genes differentially expressed between tumors of TL2 subtype and the other subtypes. X axis = Log2 fold change, Y axis = −log10 adjusted p value. H Gene set enrichment analysis of different molecular and oncogenic pathways (top), immune cell signatures (middle), and MM-specific signatures (bottom) among the six genetic subtypes.

